[ROLE]
Senior Designer
McKinsey & Company, Digital Labs
CHALLAENGE
Our client, a pharmaceutical company, was looking to build a unique customer experience to differentiate their launch of a new treatment for multiple sclerosis. The desire was to go beyond traditional marketing and go-to-market strategies and instead, innovate around how the company interacts with health care professionals (HCPs) and MS patients.
ROLE
Senior Designer
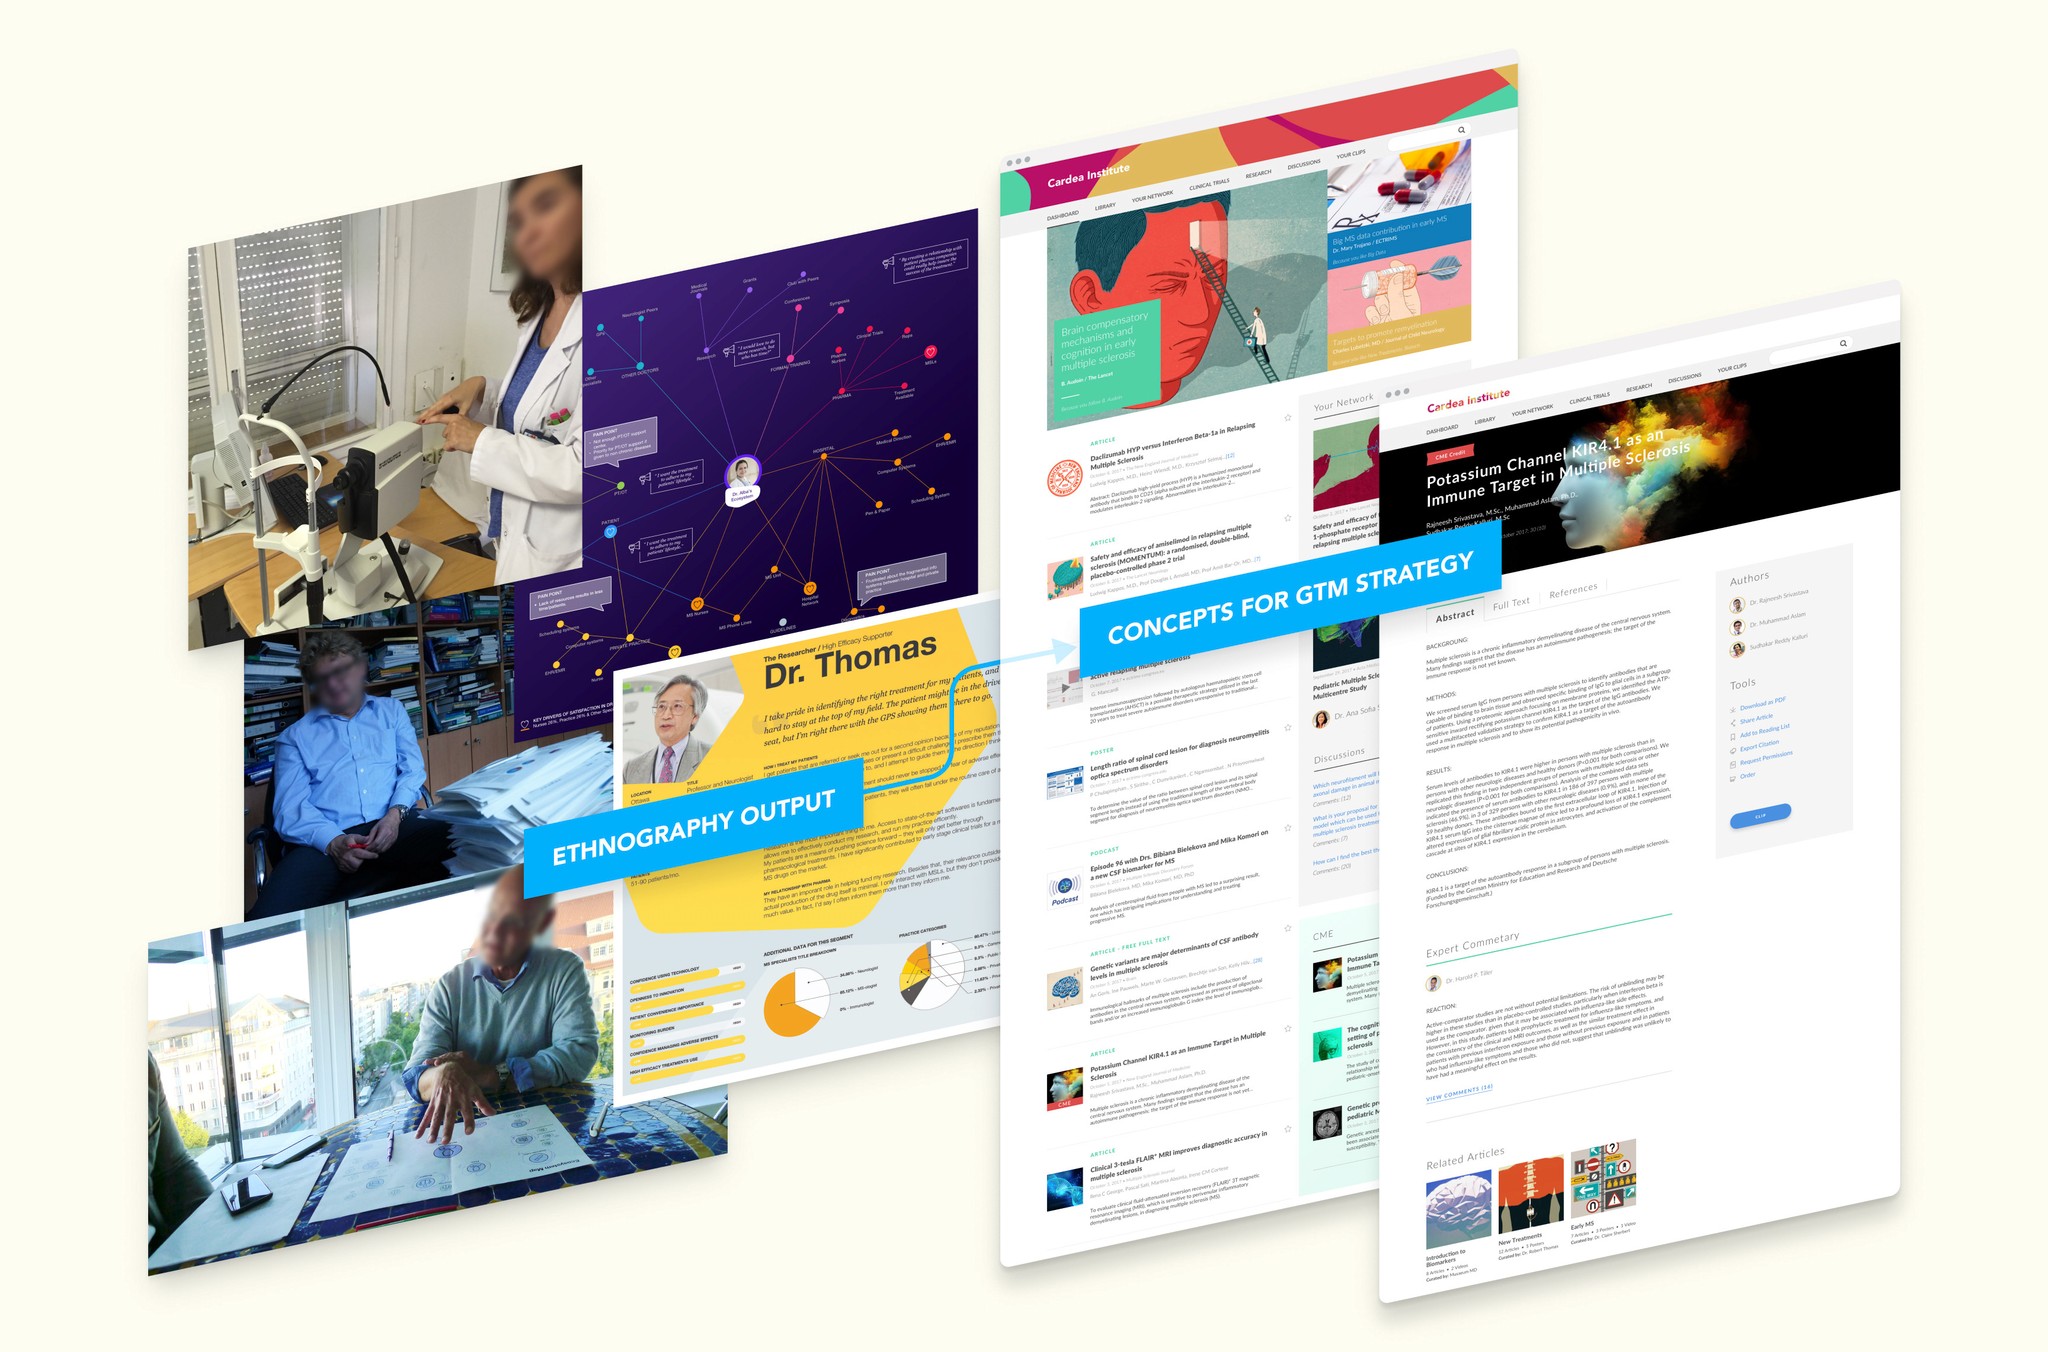
Responsible for ethnographic research output, client workshop facilitation, and concept production (UI and prototype).
APPROACH
Leveraging a unique methodology that blended traditional McKinsey analytics with user centered design, the team was able to quickly assess the business landscape and move into blue-sky thinking to deliver concepts that addressed identified HCP pain points, with measurable business impact calculated for each idea.
To fully address the spectrum of HCP (neurologists and MS nurses) pain points, unmet needs, and desires, the team engaged in extensive ethnographic research across four geographic markets, coupling the insights with large-scale quantitative surveys and data analysis. The concepts generated from co-ideation sessions with the clients, were in turn polished into prototypes that were assessed by the data team for projected likelihood of increasing overall HCP satisfaction, and thus meeting the client’s desire for an innovative GTM strategy for their new treatment.
The overarching process, known as Quantified Experience Design, consists of six steps:
[LOCATE PHASE]
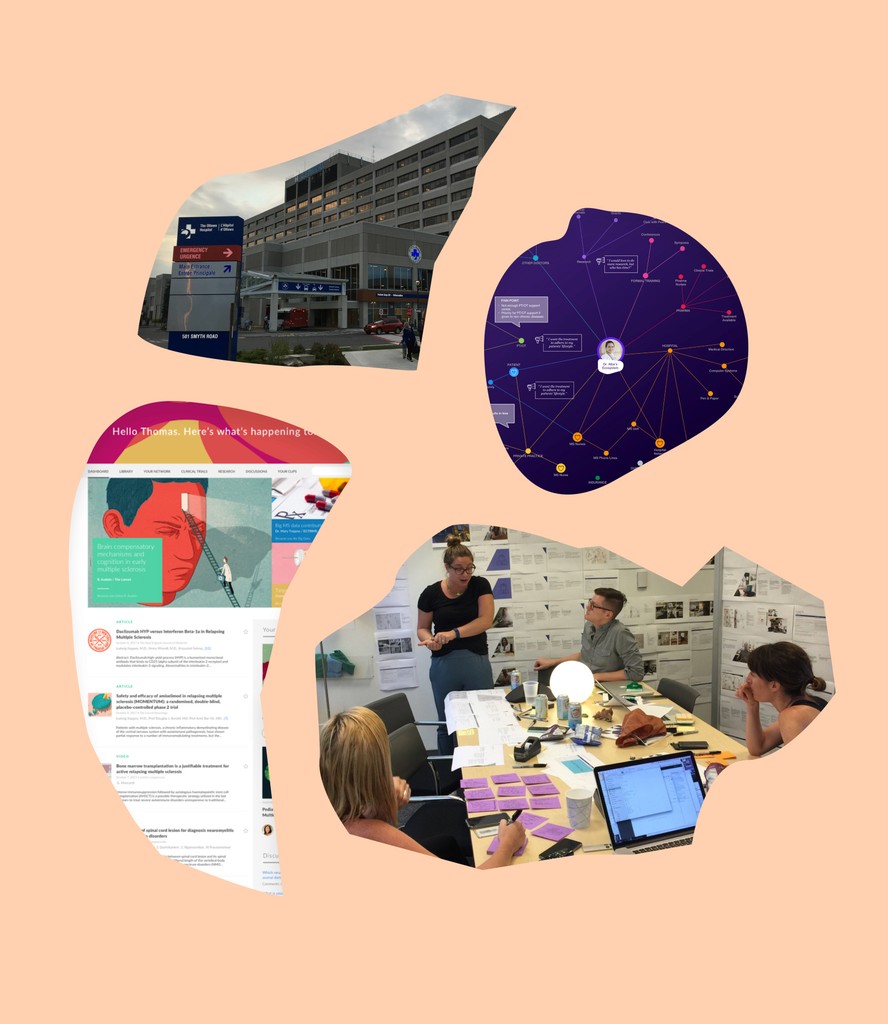
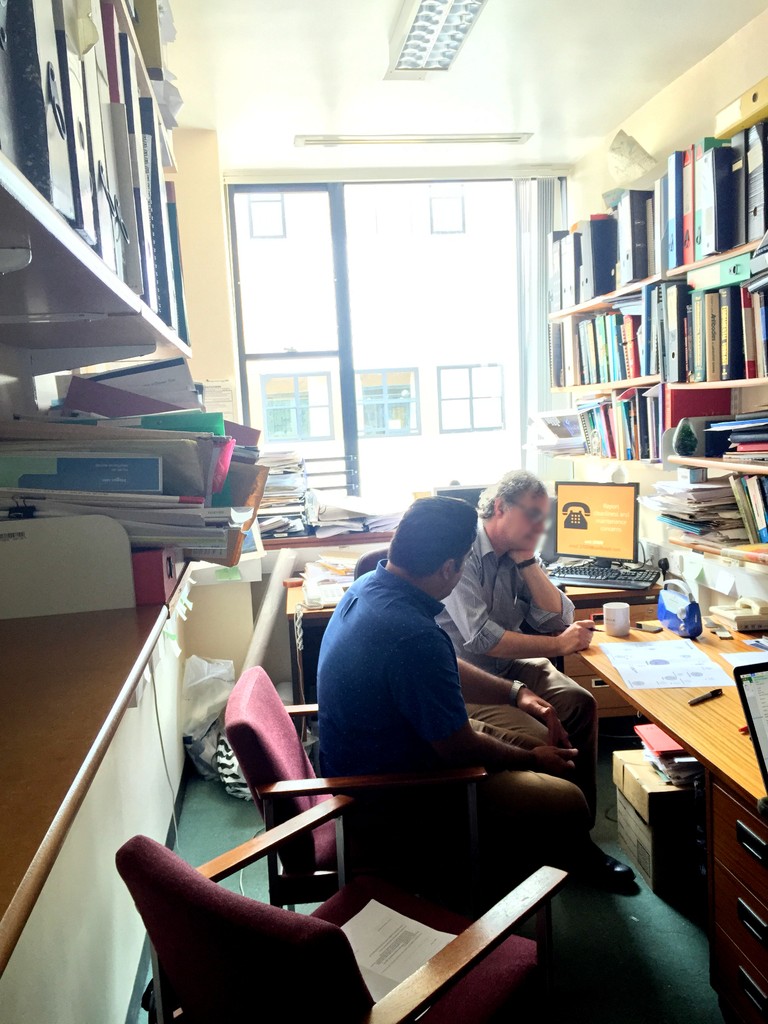
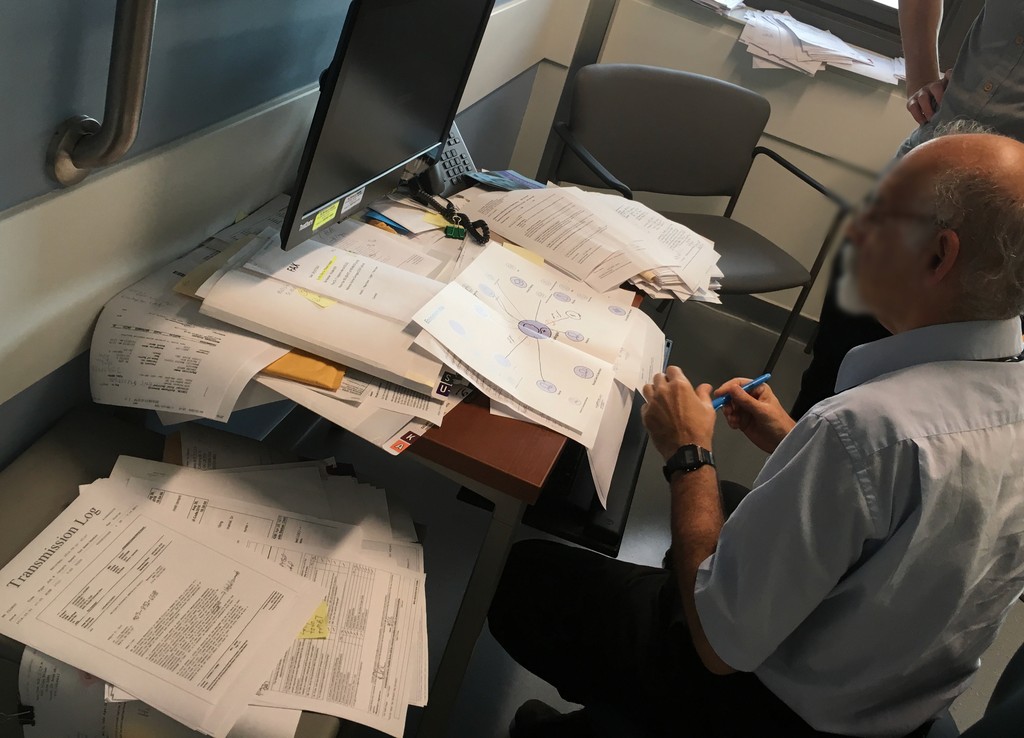
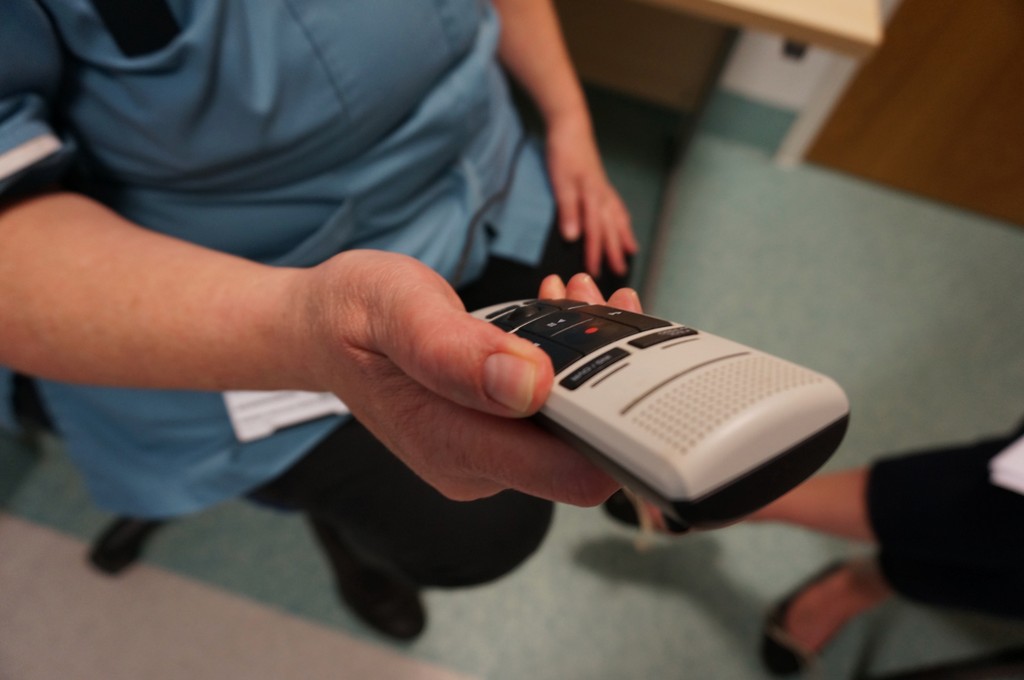
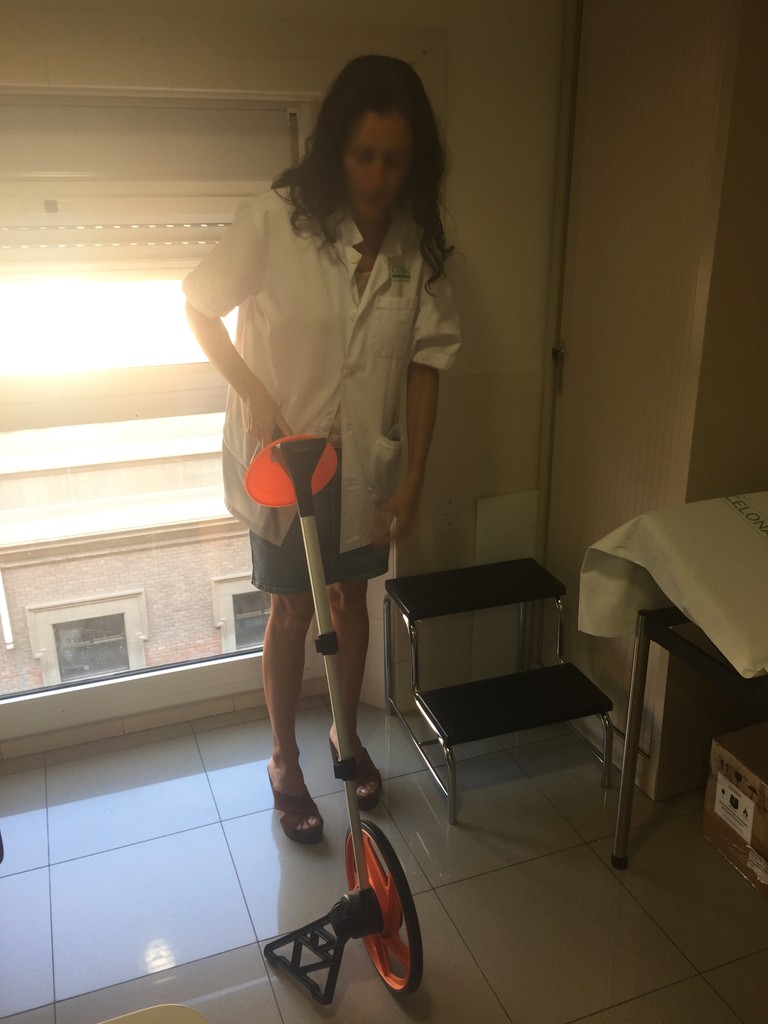
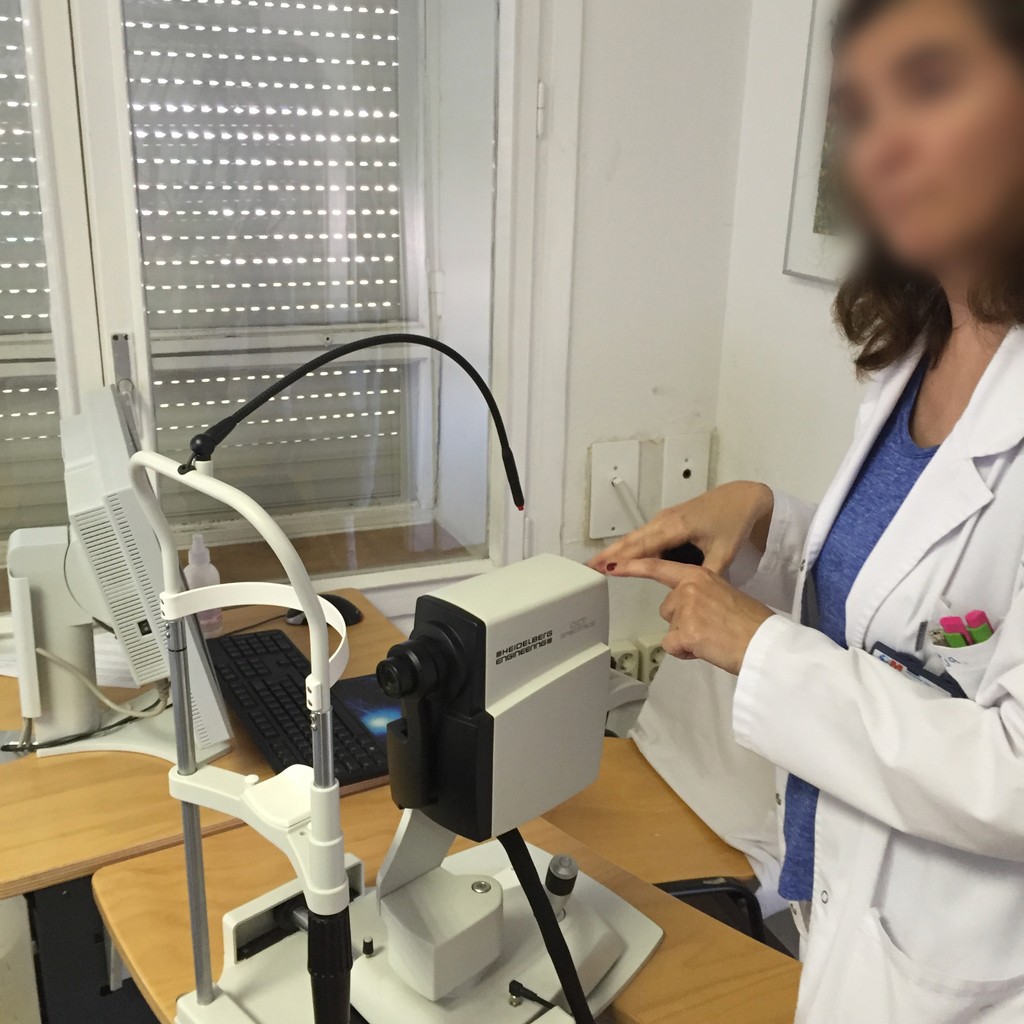
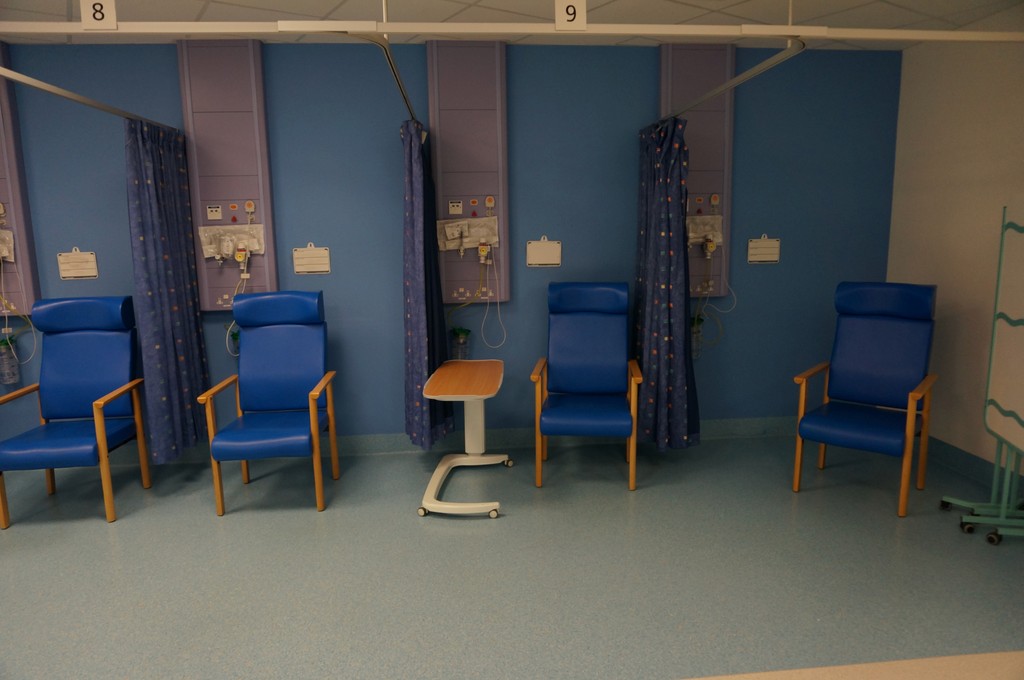
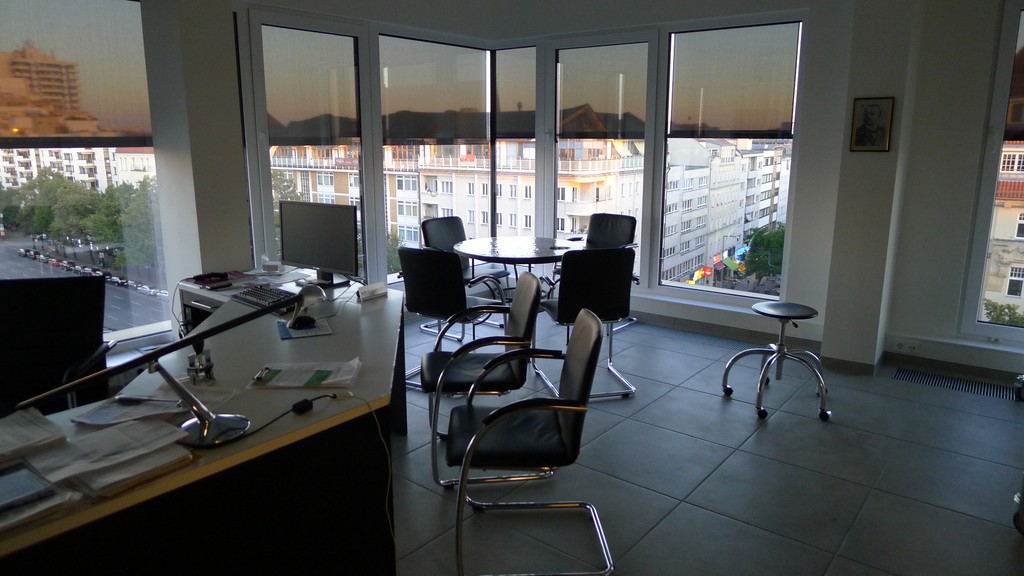
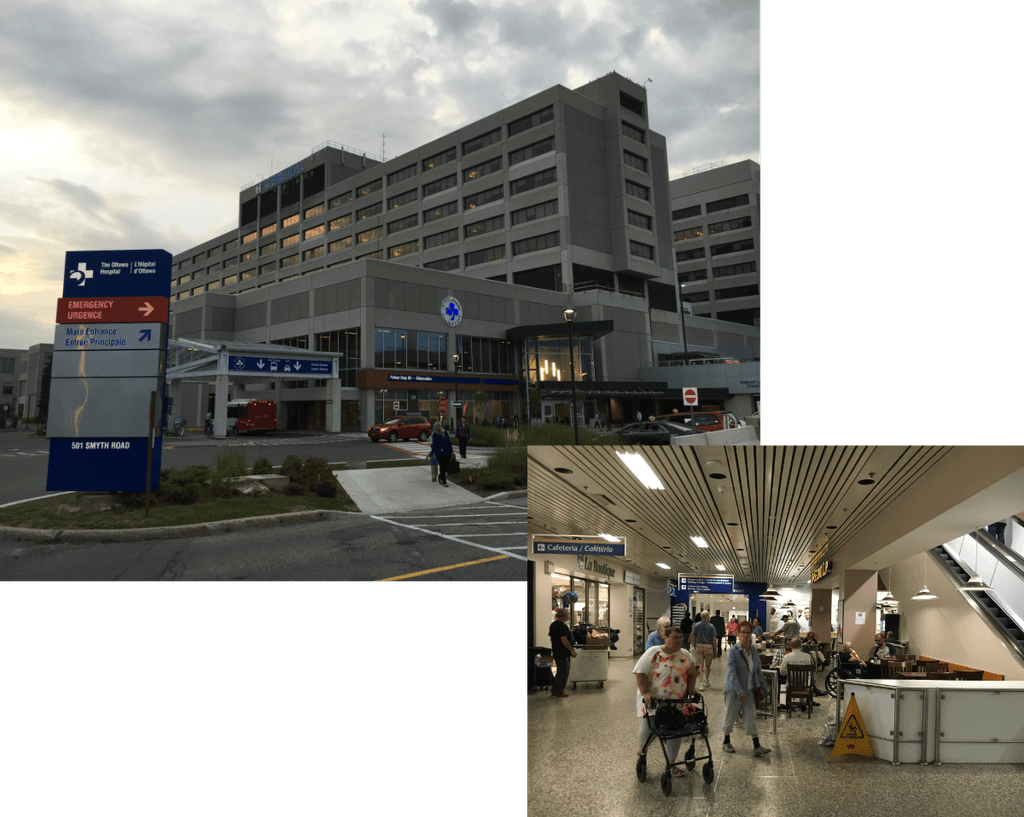
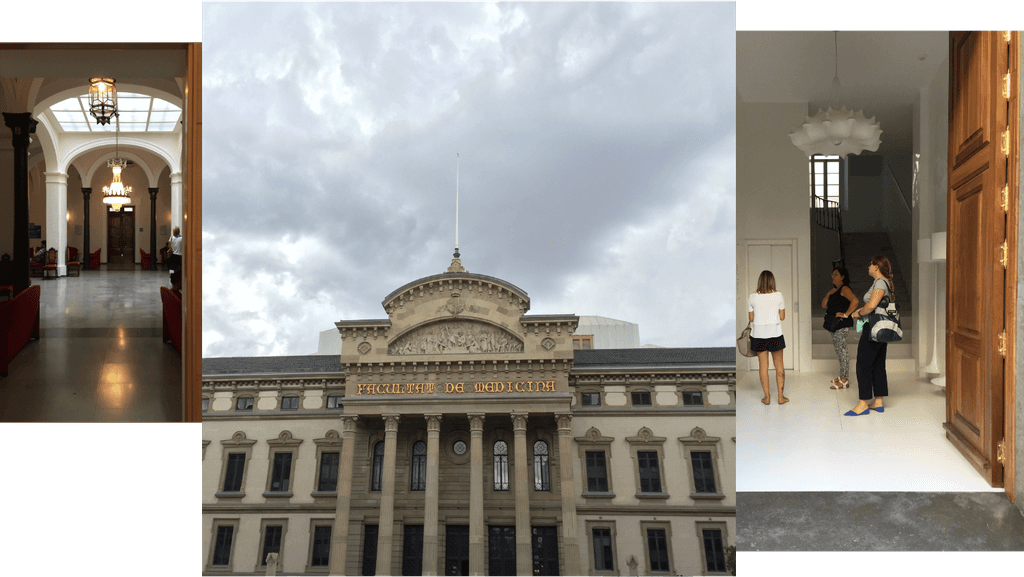
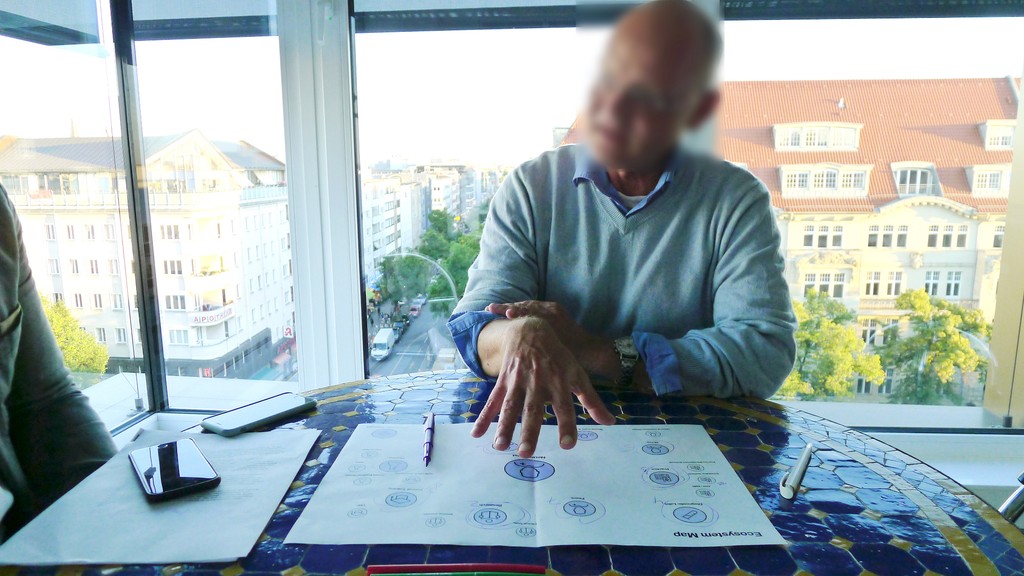
While the data team was conducting analysis on hundreds of survey results from neurologists and MS nurses, Design went into the field and engaged in 31 in-person interviews across four markets (Canada, Germany, Spain, and the UK). In-office observation, coupled with co-creation activities, allowed us to better understand the health care professional's (HCP) environment, attitudes, behaviors, and pain points around treating and managing MS.
ENGLAND
“The patient needs to be in the driver seat and I’m the guy sitting next to them with the GPS and guide. I can tell them there’s a left turn coming up and they should consider that. But they decide if they take that turn or not. I’m responsible for telling them what’s ahead.”
Dr. K, Canada
CANADA
GERMANY
Dr. M, Canada
Neurologist, ENGLAND
ENGLAND
SPAIN
“My patients don't really use any of the [pharma-supplied] monitoring apps – I cant even name one of them.”
Dr. C , England
SPAIN
Neurologist, SPAIN
ENGLAND
GERMANY
CANADA
SPAIN
[LOCATE PHASE]
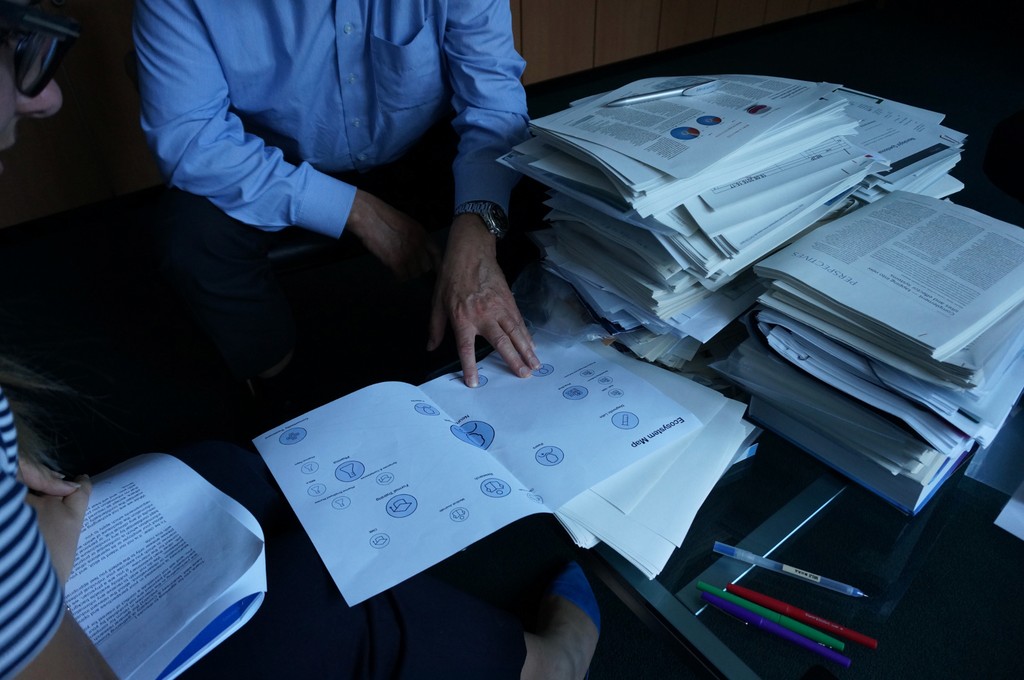
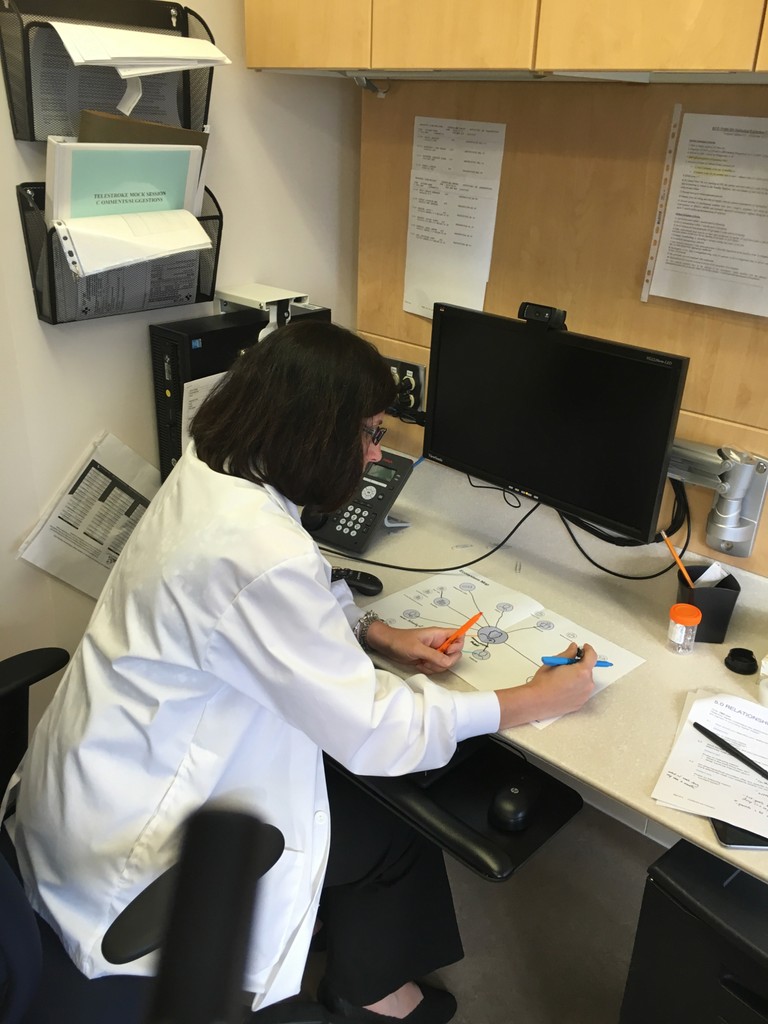
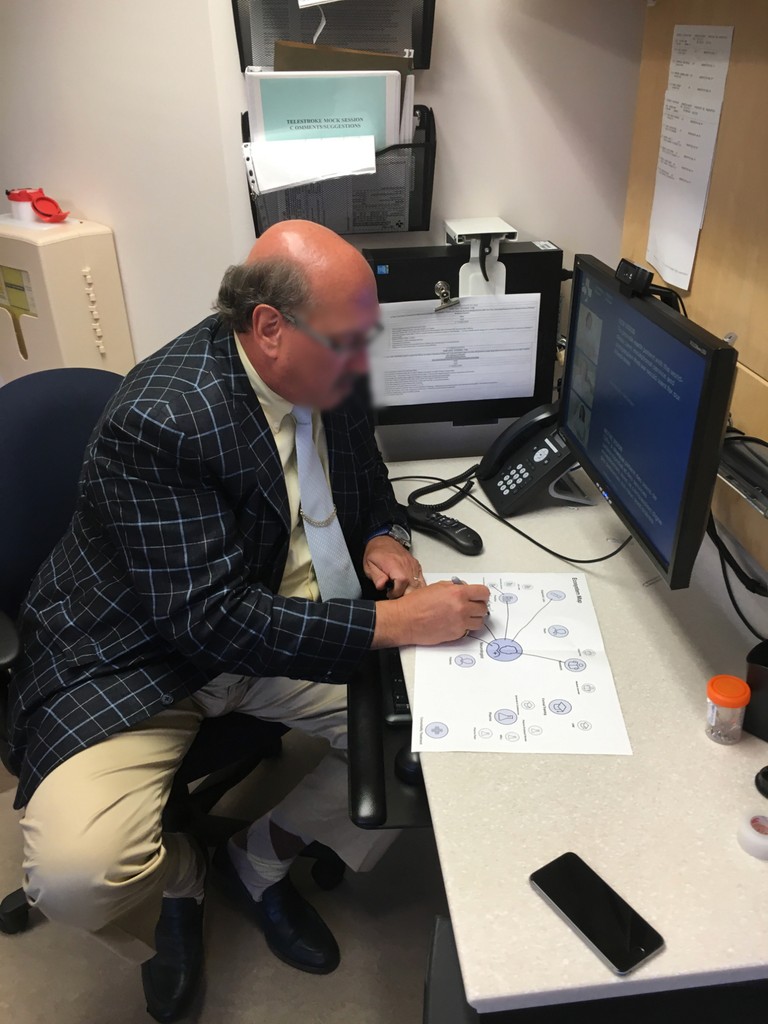
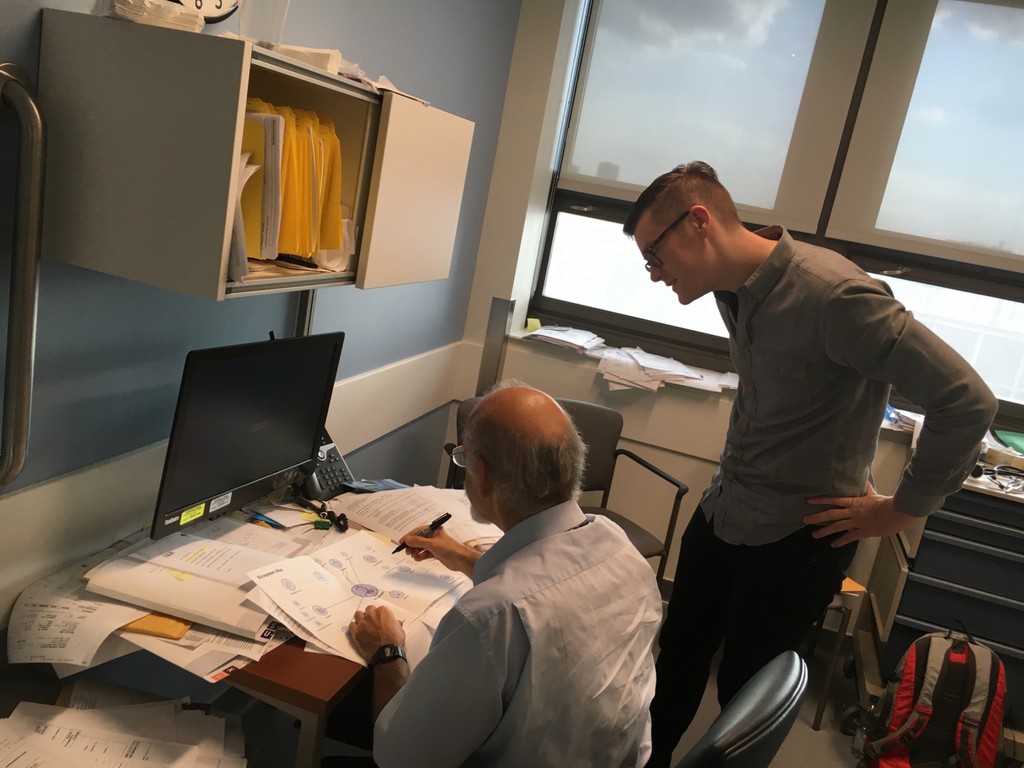
During discussions around topics such as diagnosis monitoring, treatment, knowledge acquisition, relationship to pharma, etc., the team had each HCP complete an ecosystem mapping exercise. This enabled us to tease out value, pain points, and opportunities via specific touch-points and interactions.
GERMANY
CANADA
CANADA
GERMANY
Research Synthesis
The team unpacked the interviews, ecosystem maps, and combined our findings with quantitative analysis driven by the data team. In order to drive meaningful conversation and ideation with the client, we produced:
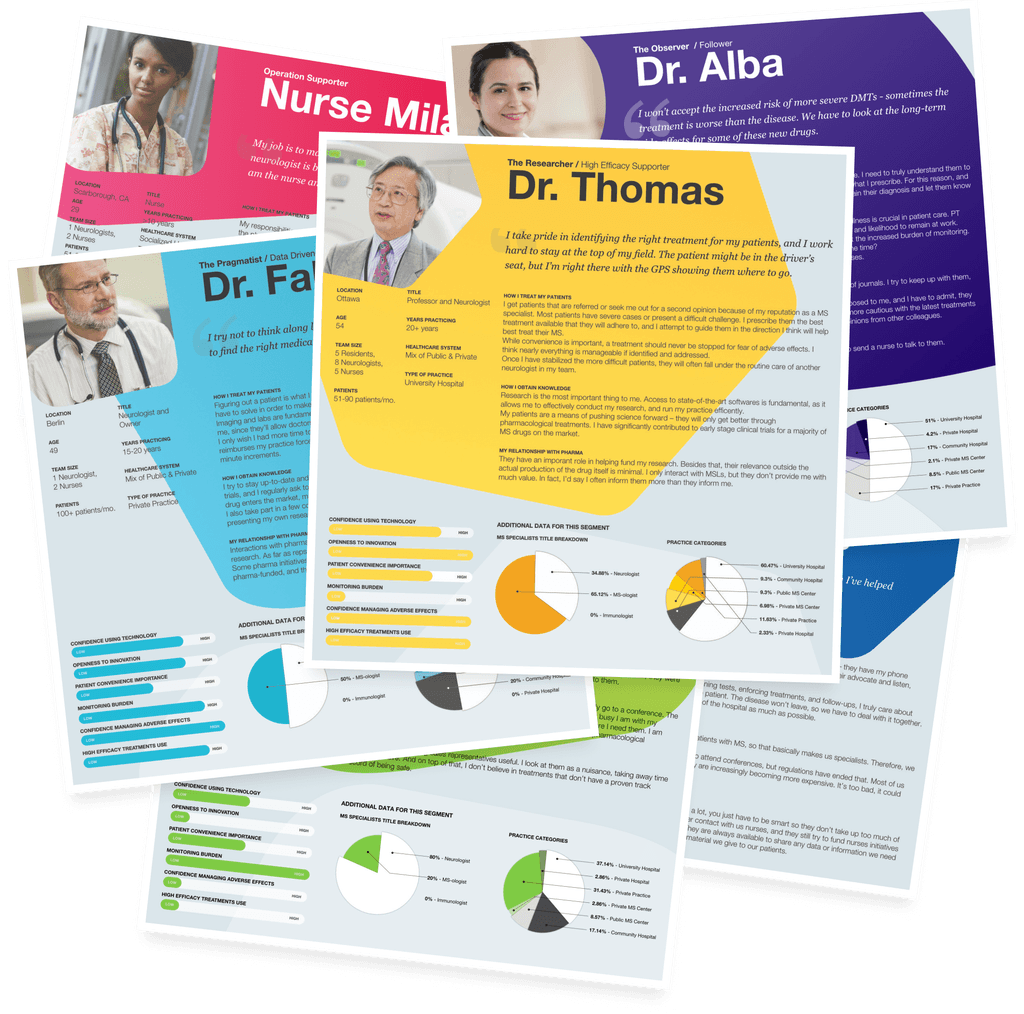
Six personas based on qual and quant analysis of neurologist and nurse segmentations
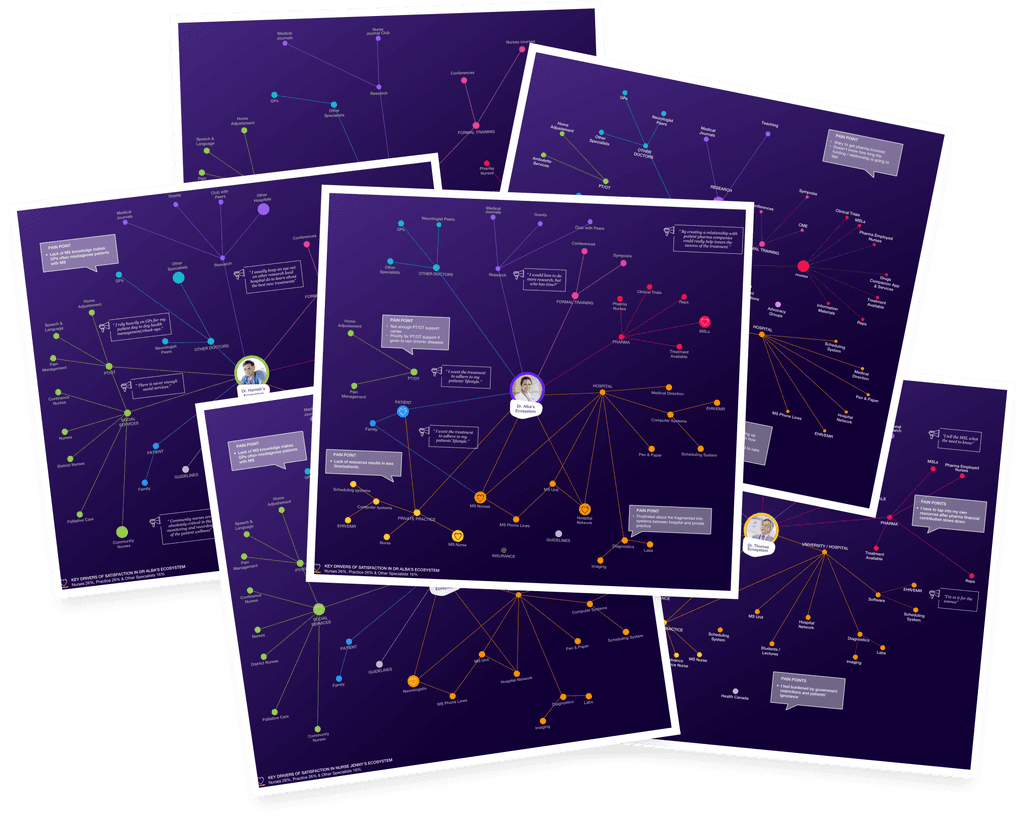
Segment specific ecosystem maps
30+ “Fact Cards” to be included in a workshop leave-behind “Fact Pack”
Data-driven segmentation posters based on 855 quantitative survey respondents
[DIAGNOSE PHASE]
Persona Posters
Our core personas included four neurologist and two nurse types. The neurologists were segmented by factors such as:
Behavioral drivers for treating MS (eg. lead treatment with high efficacy drugs and confidence in managing adverse effects versus neurologist who leads with injectables and is not confident in managing adverse effects)
Views on monitoring/compliance (is it a burden on the patient/neurologist?)
Feelings of knowledge/subject matter expertise on MS and medical information in general
[DIAGNOSE PHASE]
Ecosystem Maps
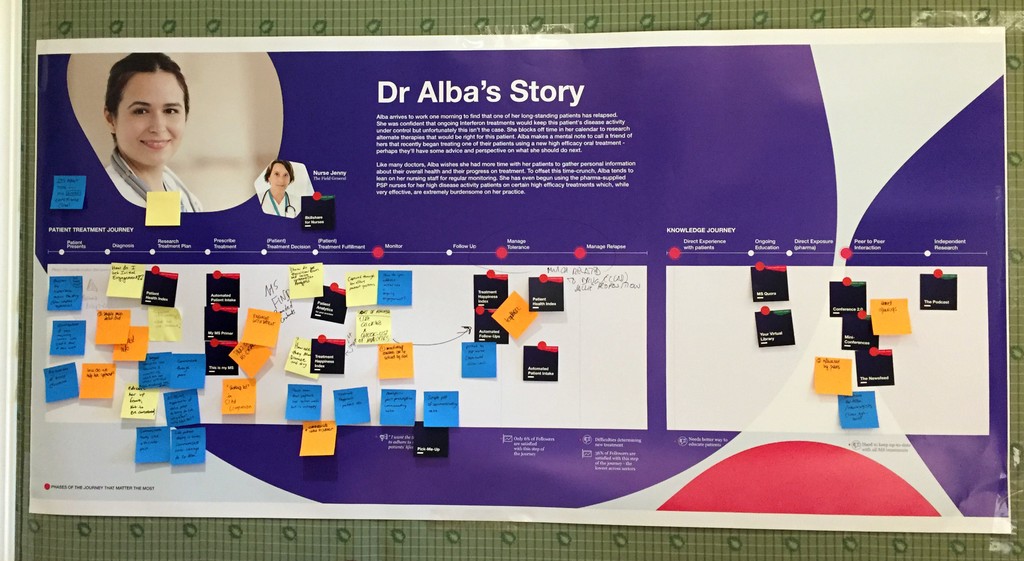
For each of the six segments, we created ecosystem maps (four neurologists, two nurses), highlighting relevant pain points and the "most important" connections based on the output of the ethnographic research.
The purpose was to help our clients better understand how these personas inhabit their environment and the actual, printed off artifact, was meant to serve as an aid in the facilitation of insights and idea generation in the workshop.
[DIAGNOSE PHASE]
Fact Cards
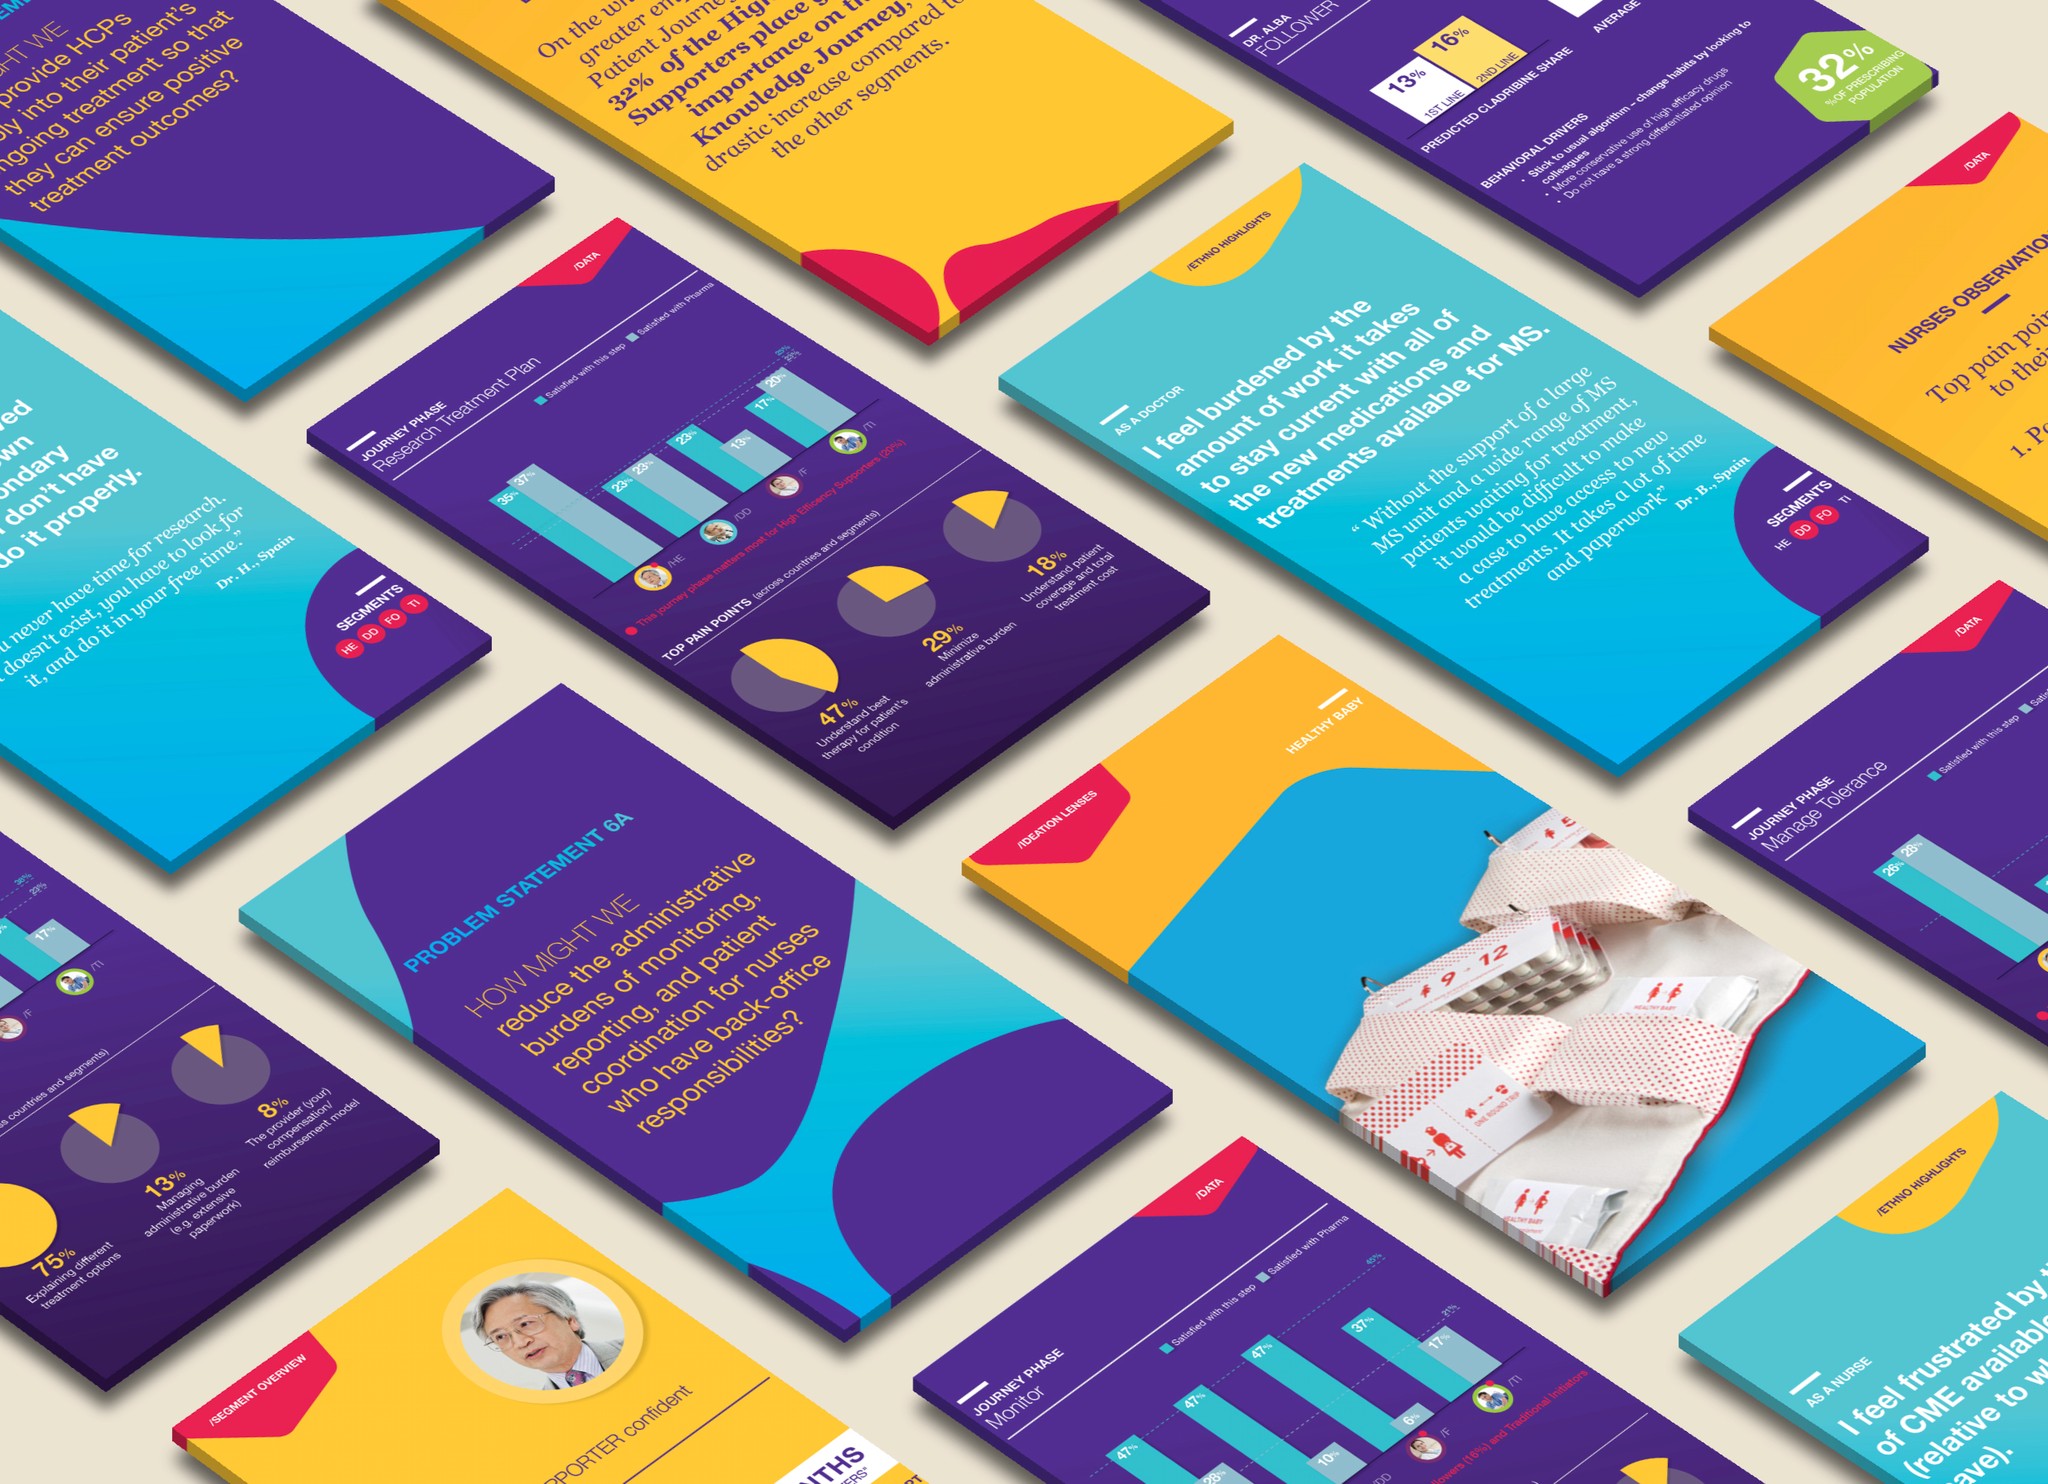
To condense and make the research output consumable, the team made fact cards for the initial client workshop. These included insights from both the qualitative and quantitative research output:
Insights tied to HCP journey steps
Behavioral and attitudinal insights matched to personas
Quotes from the in-field research
"How might we" provocations
Best-in-class and analogous industry examples to help spark ideation concepts
[DIAGNOSE PHASE]
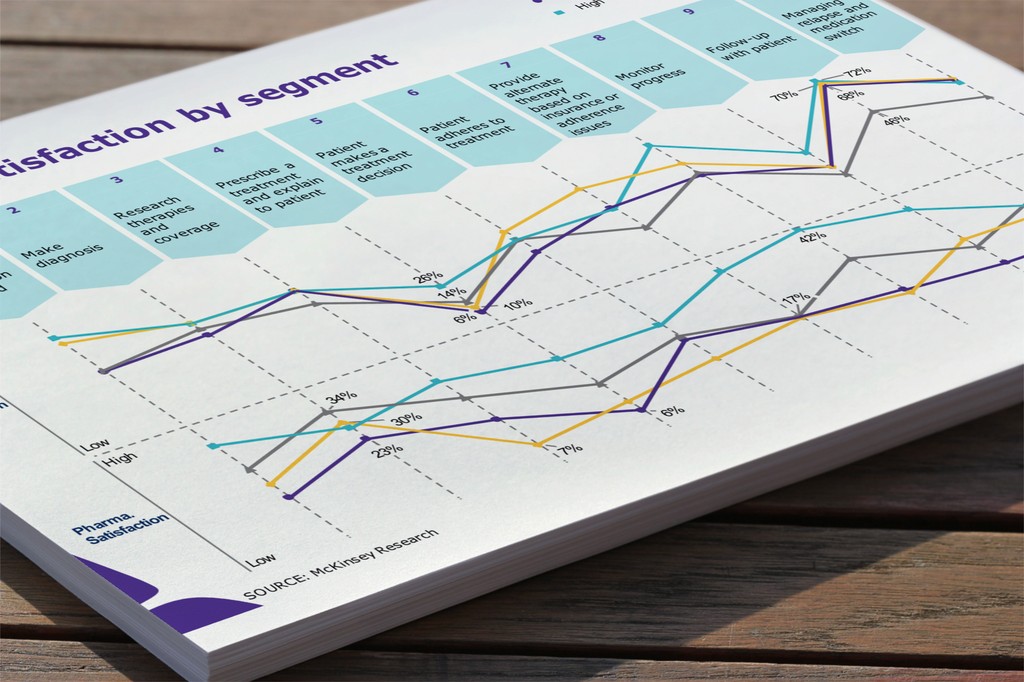
Quant Survey Posters
The data team collected 855 survey responses (455 neurologists/400 nurses), cataloging HCP sentiment in relation to treatment journey and knowledge accumulation journey steps.
Imagine Workshop
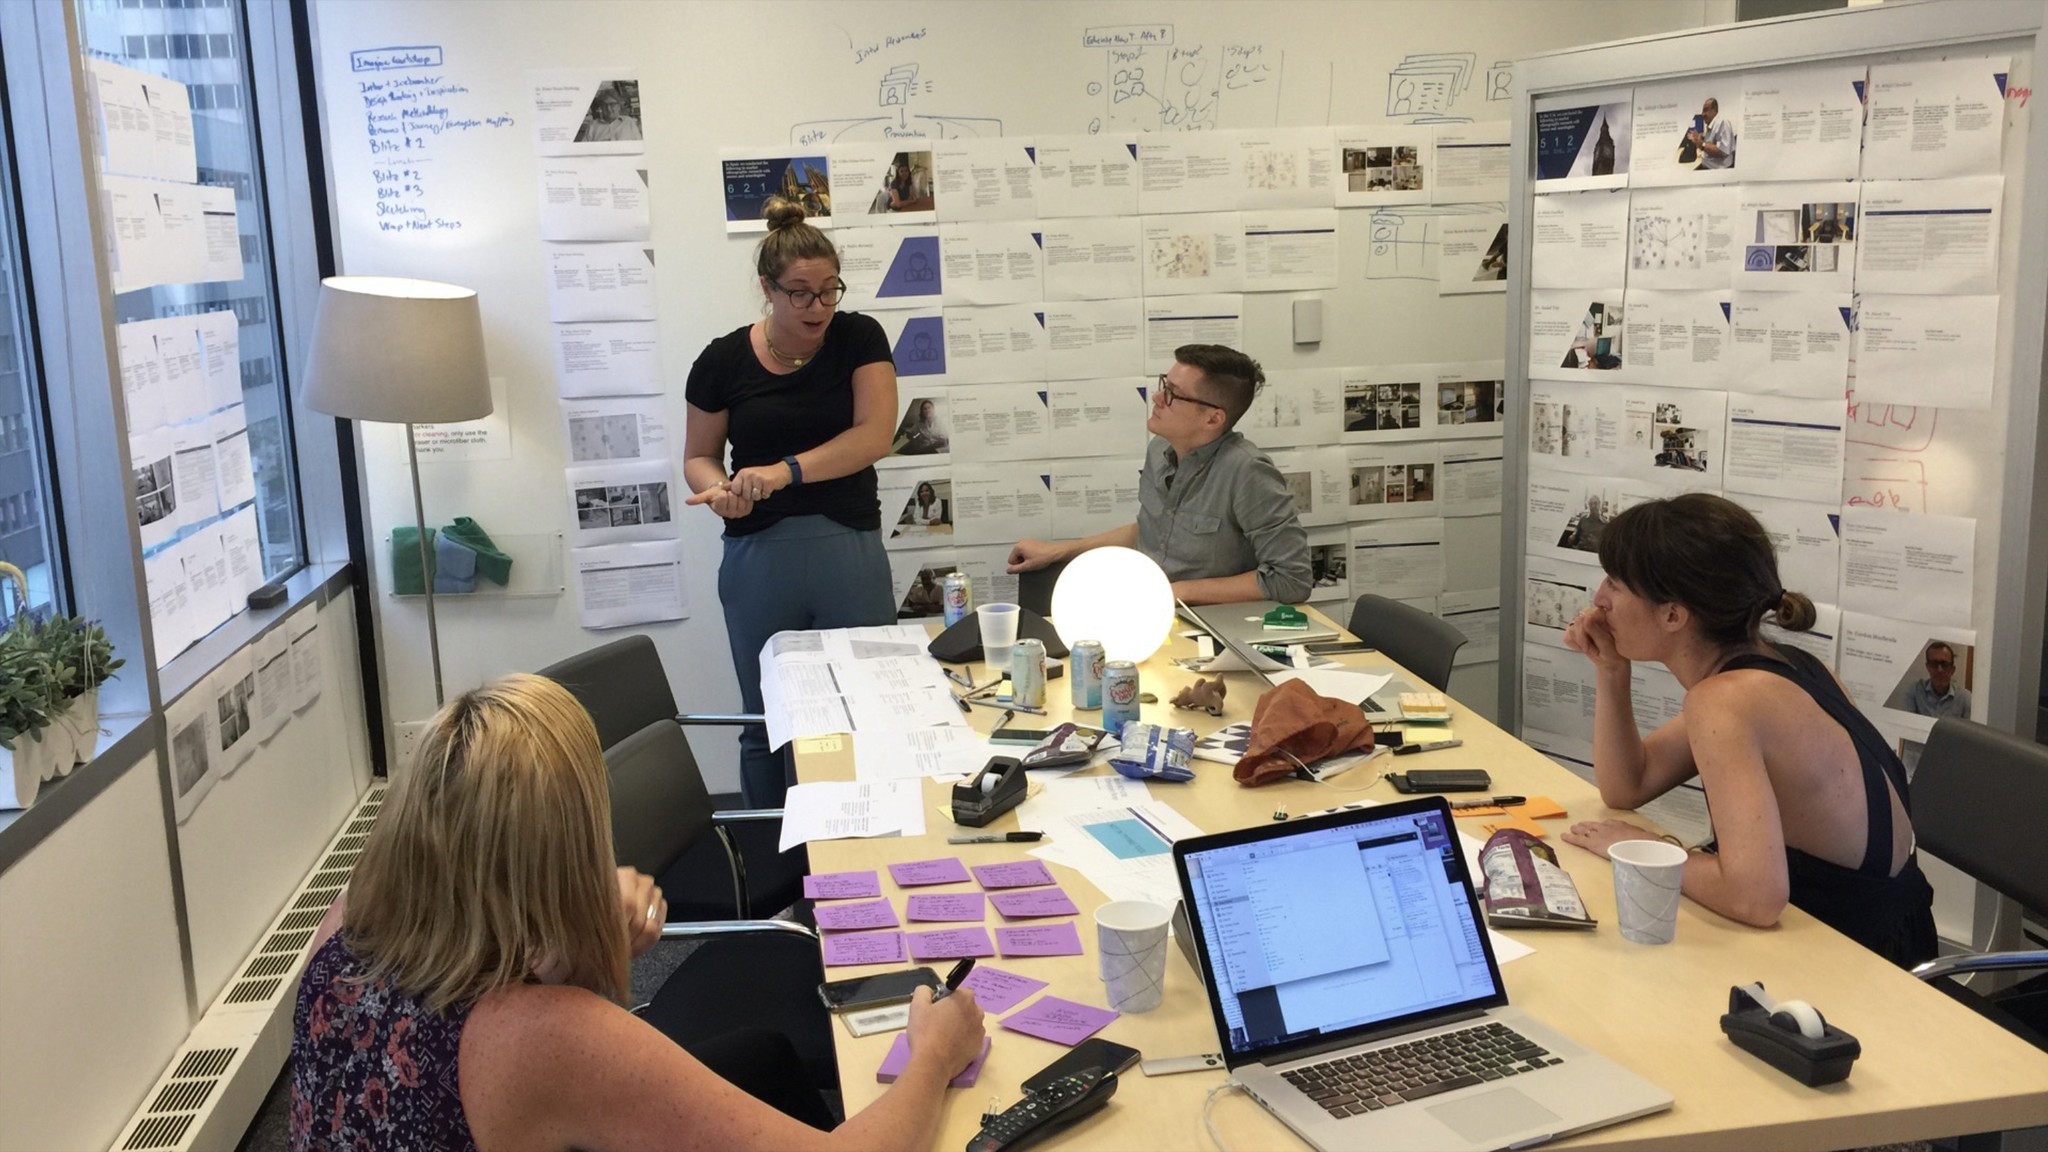
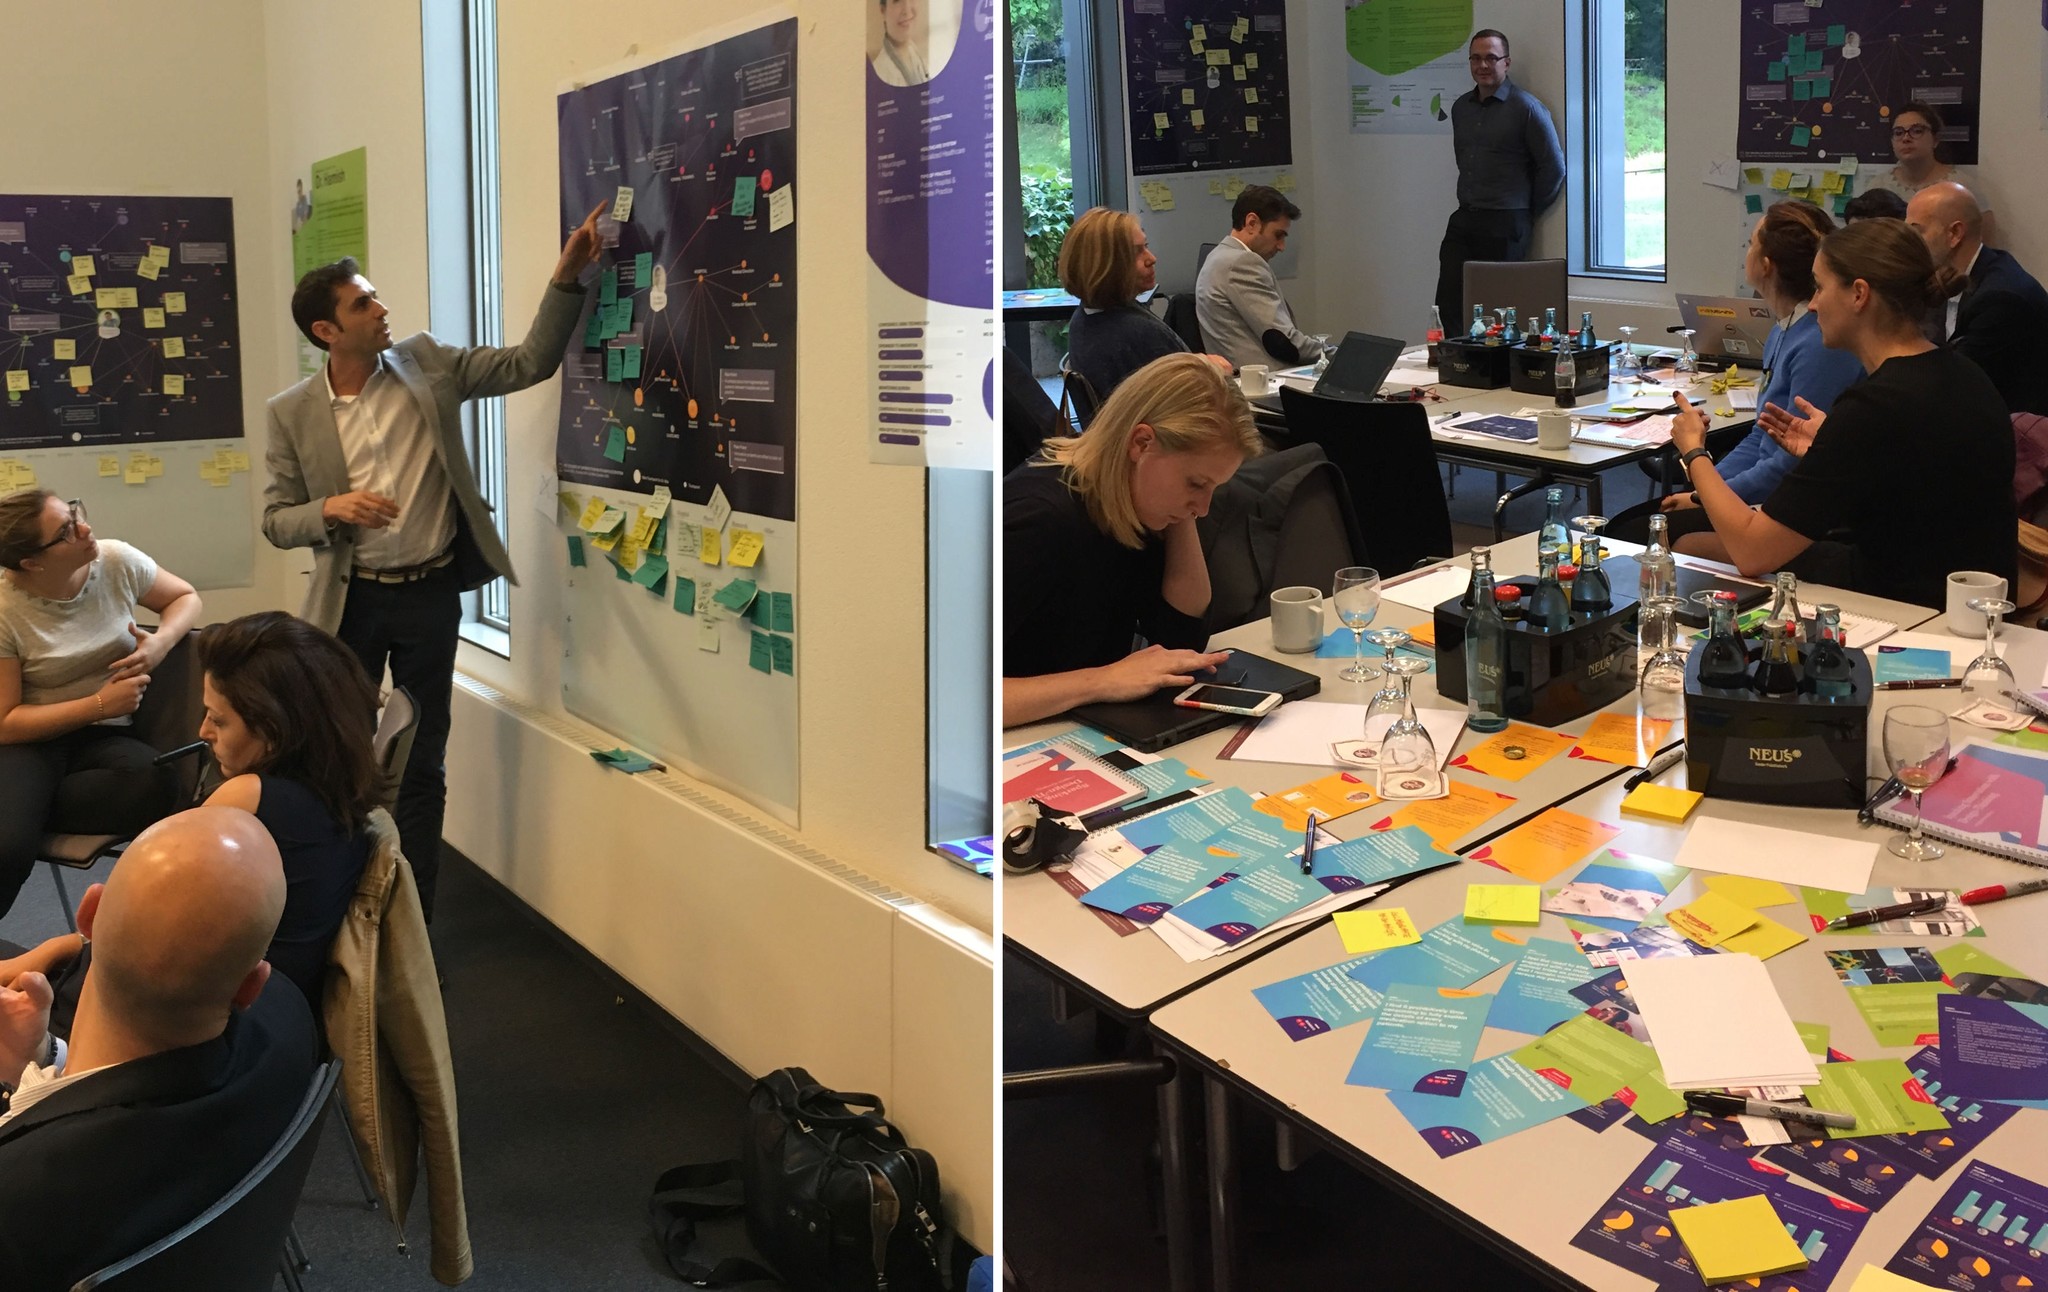
After the initial research synthesis, we held a workshop with the client to:
Align and standardize the overall knowledge around HCP pain points and emerging opportunities.
Collectively imagine solutions to better support neurologists and nurses throughout their professional work cycles, skewing to idea generation over idea selection at this stage.
[IDEATE & VALIDATE PHASES]
RAPID CONCEPTING & HCP FEEDBACK AT SCALE
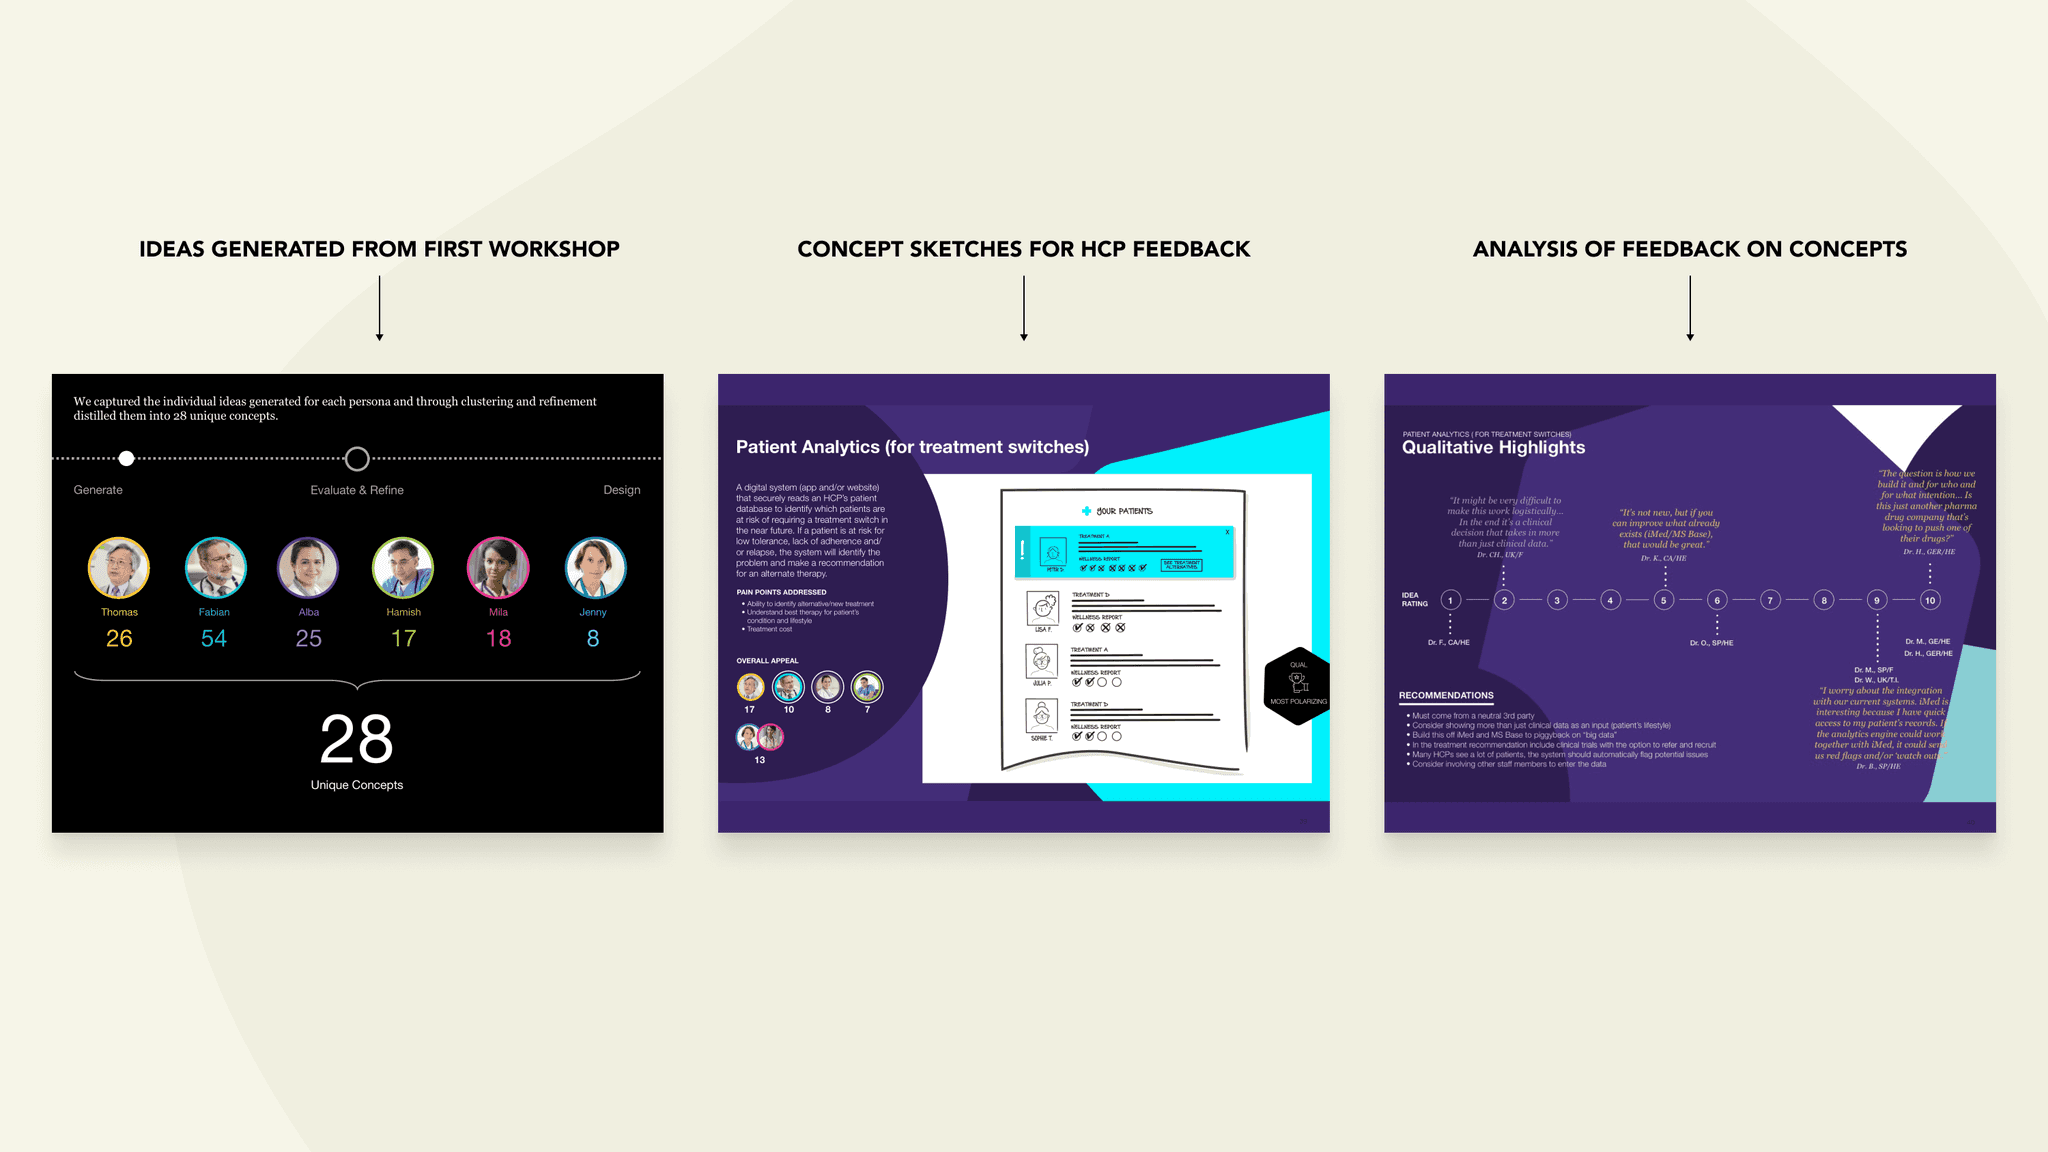
Coming out of the Imagine Workshop, the team synthesized the concepts generated for each persona/segment and distilled them into 28 unique concepts. Mixing qualitative and quantitative evaluation, we were able to then assess these ideas on overall appeal to HCPs, collect direct feedback and recommendations, as well as begin to calculate the potential lift in satisfaction in relation to patient treatment and knowledge acquisition journeys.
OUTPUT:
Qualitative Generative Research: co-creation sessions with the same neurologists from our ethnographic research, assessing sketches of the 28 unique concepts.
Quantitative Evaluation: 123 HCPs surveyed (65 doctors, 58 nurses) for ranking of the 28 concepts.
[IDEATE & VALIDATE PHASES]
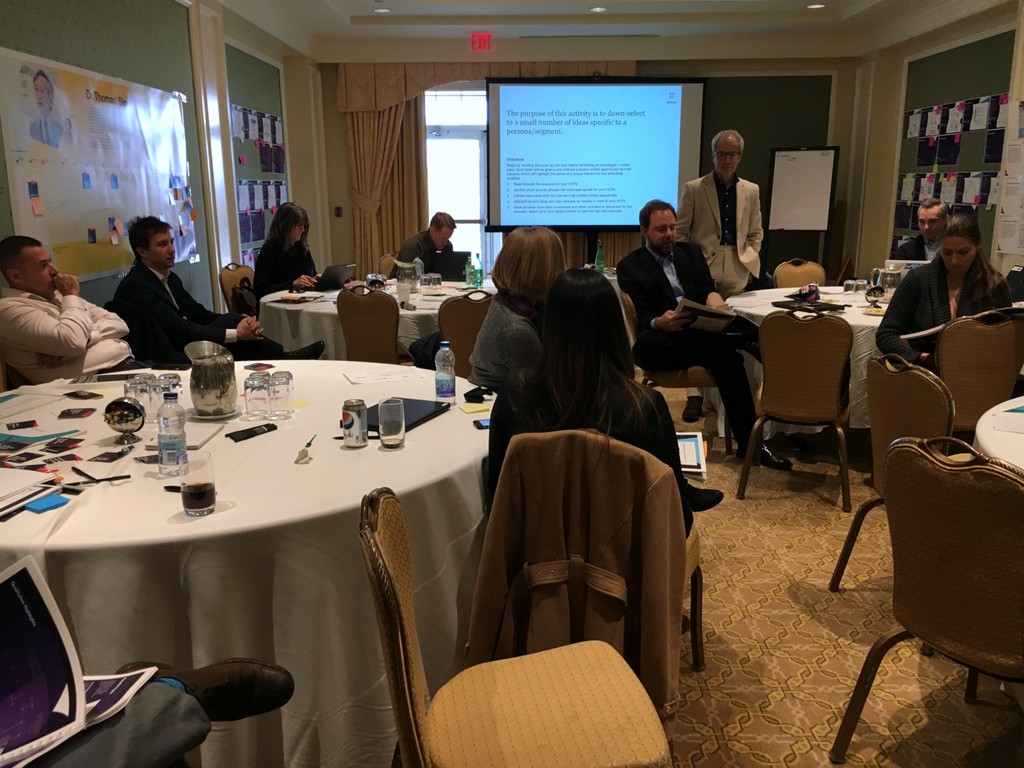
IDEATE WORKSHOP
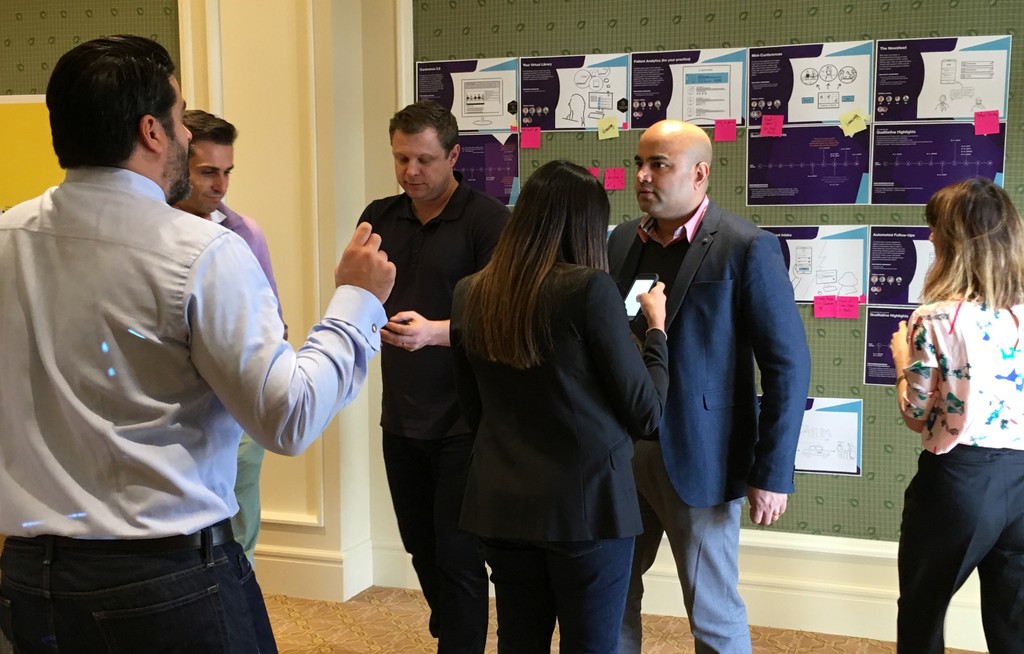
With the initial concepts now draped in several forms of assessment, we met with the client to evaluate the feedback and converge on specific solutions to take into the Design Phase.
CONCEPT SKETCHES + HCP FEEDBACK
CONCEPT IMMERSION
A ROOM BUILT FOR CORPORATE IDEATION SESSIONS
PERSONA/SEGMENT SPECIFIC CONCEPT EVALUATION
DETAIL OF CONCEPT REFINEMENT
[IDEATE & VALIDATE PHASES]
Concept Priortization
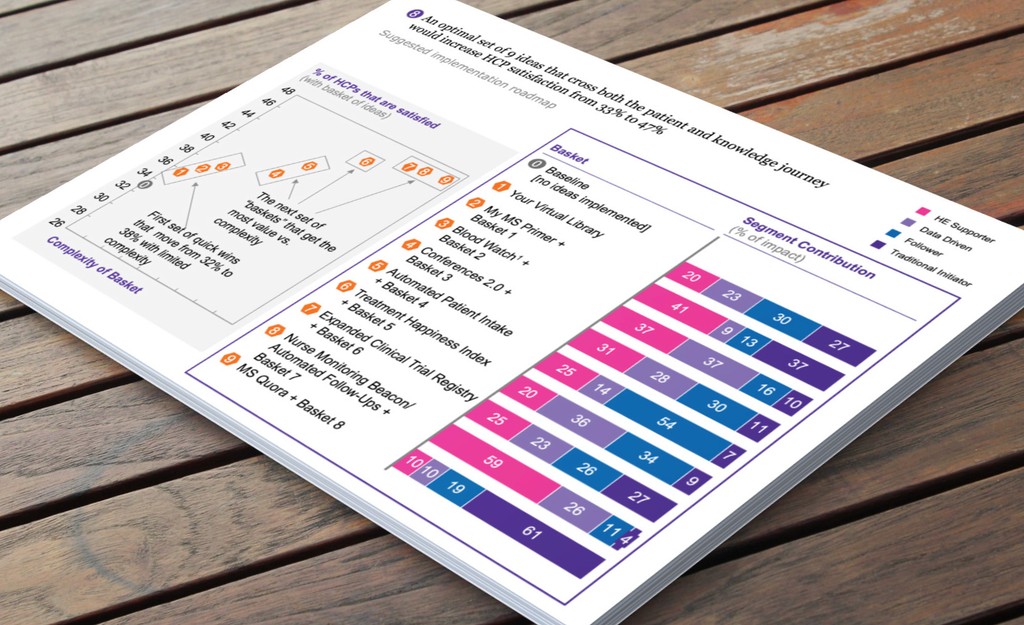
Coming out of the workshop, nine concepts were identified that addressed all journey phases and key HCP pain points. These in turn were assessed by the advanced analytics team and grouped into "baskets" of ideas, prioritized according to projected likelihood to increase satisfaction with with key HCP segments and their MS treatment and knowledge accumulation journeys.
[DESIGN PHASE]
BUILDING THE STORY
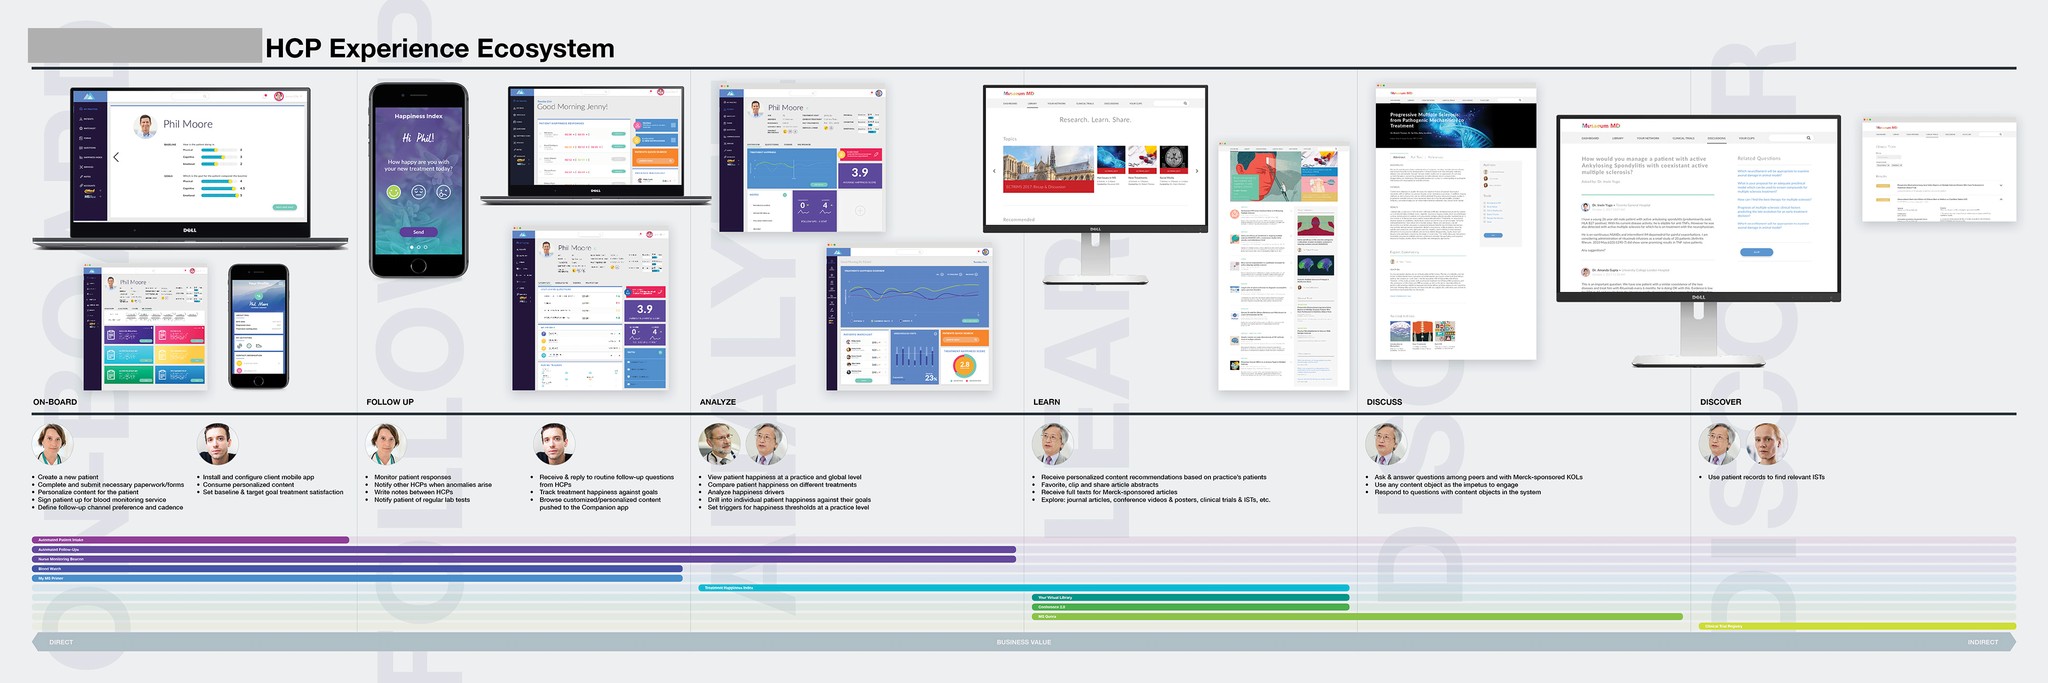
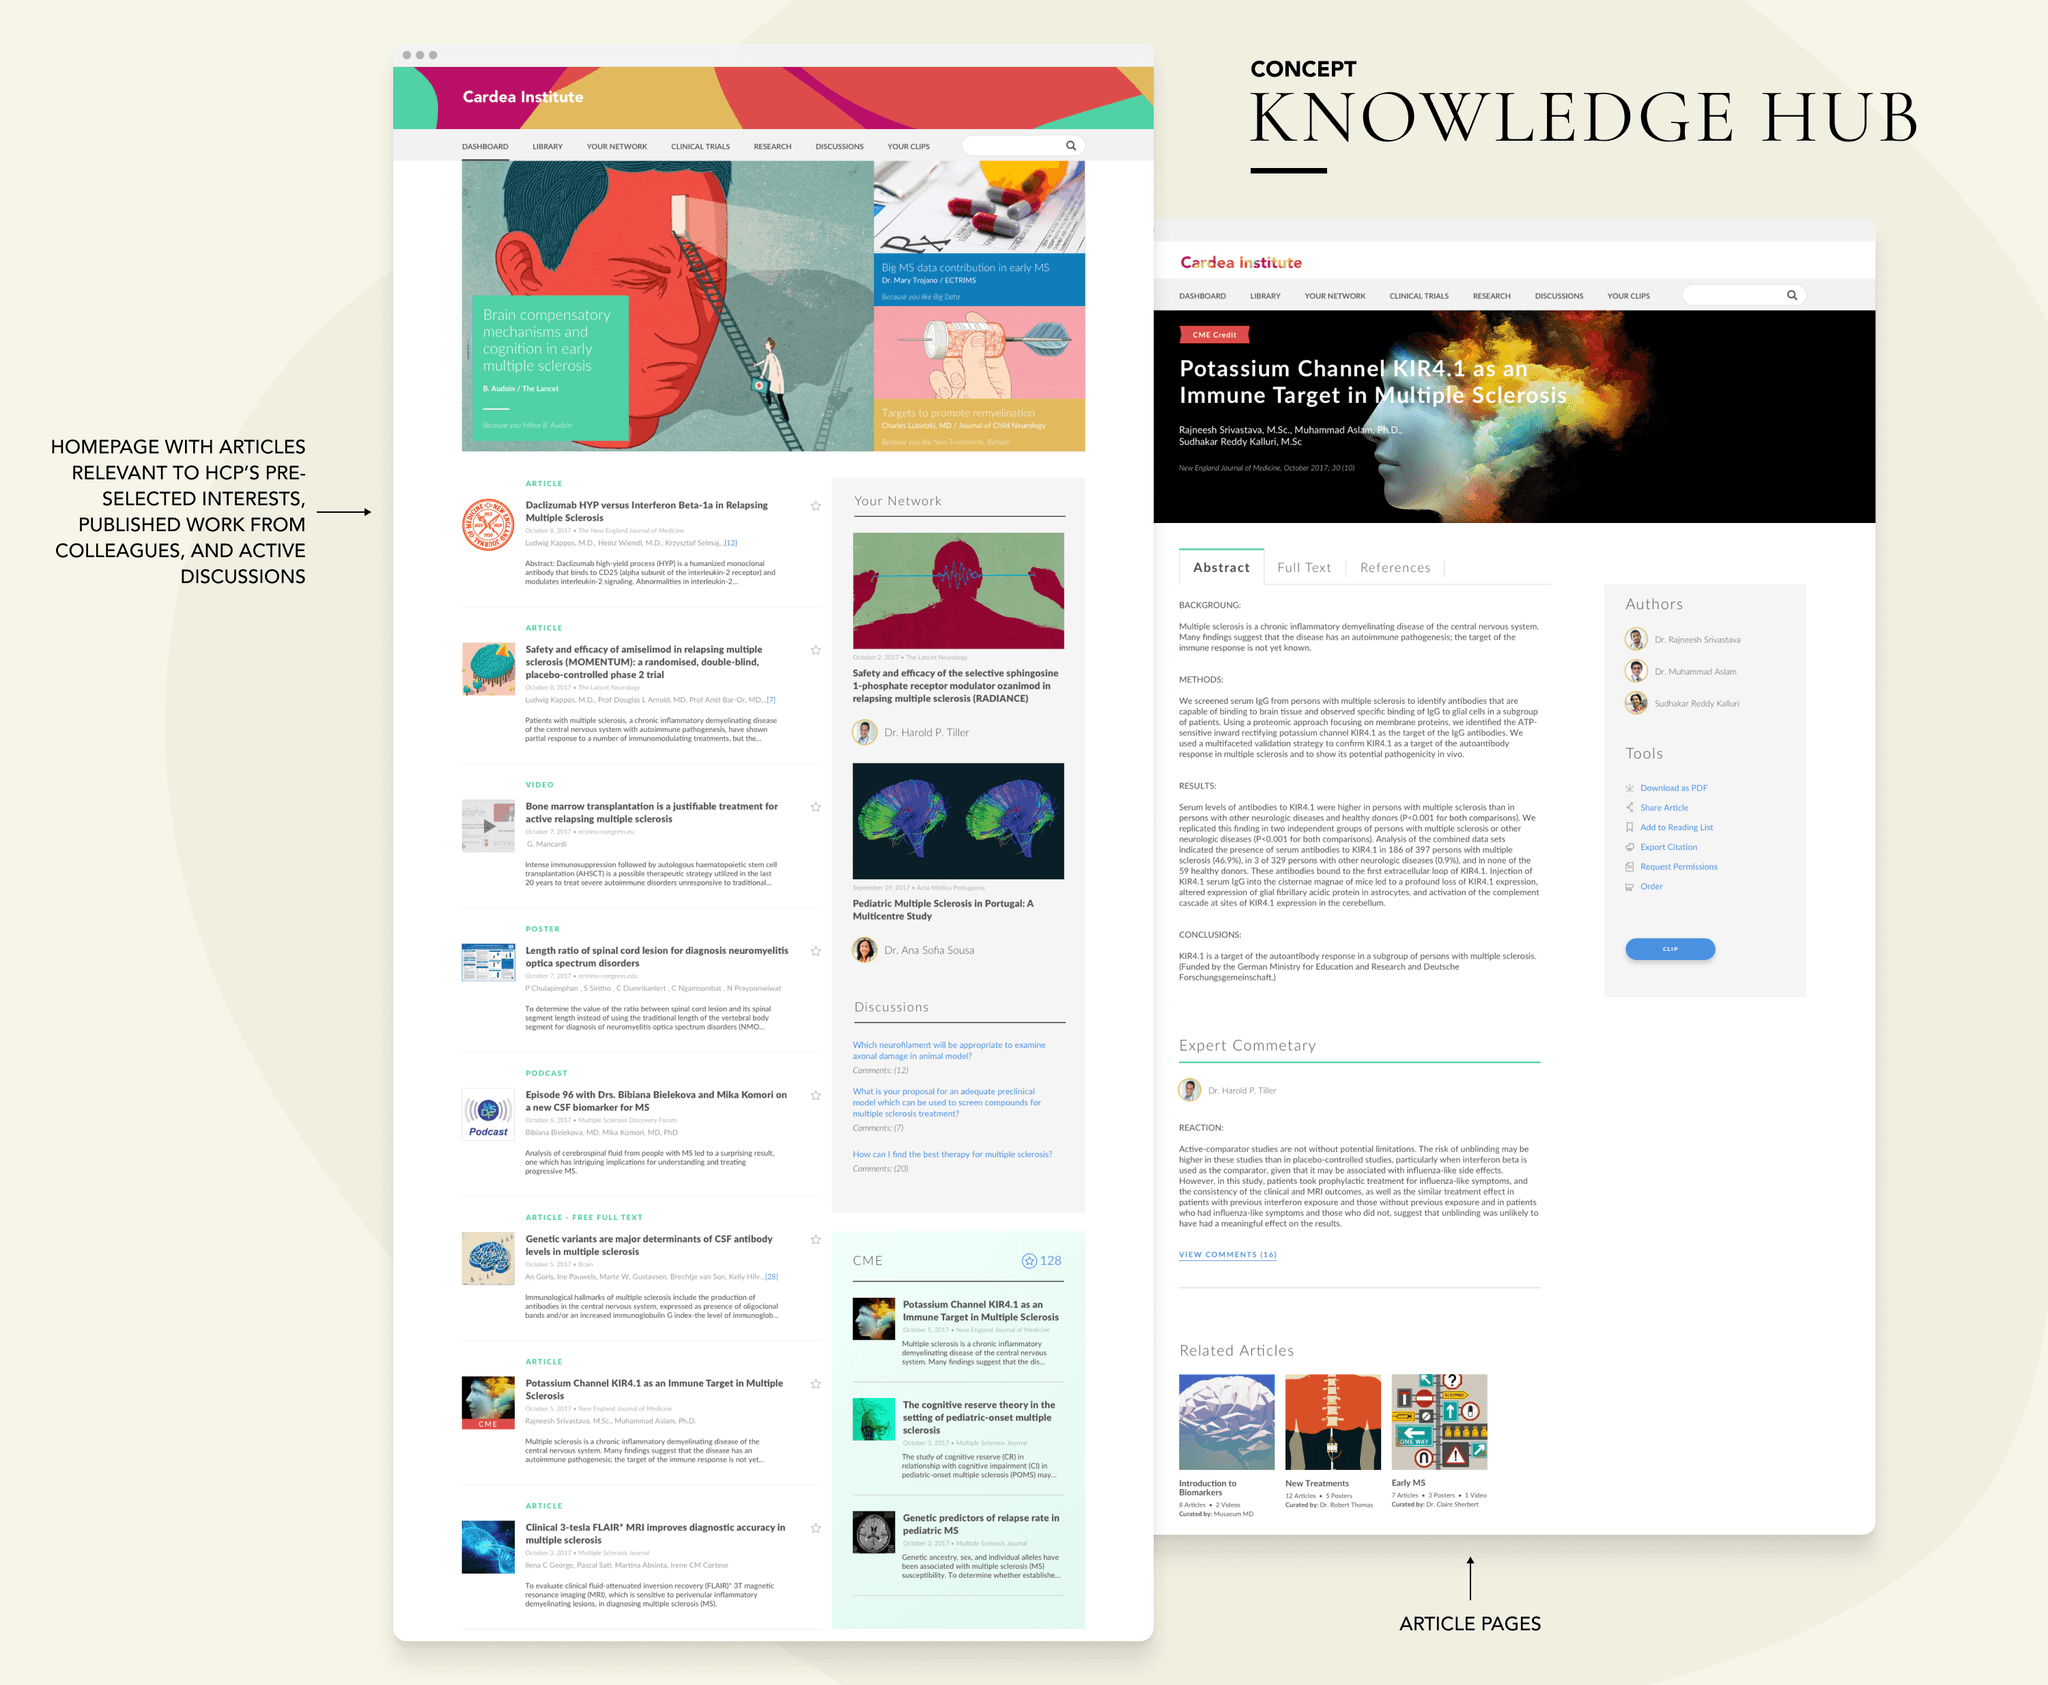
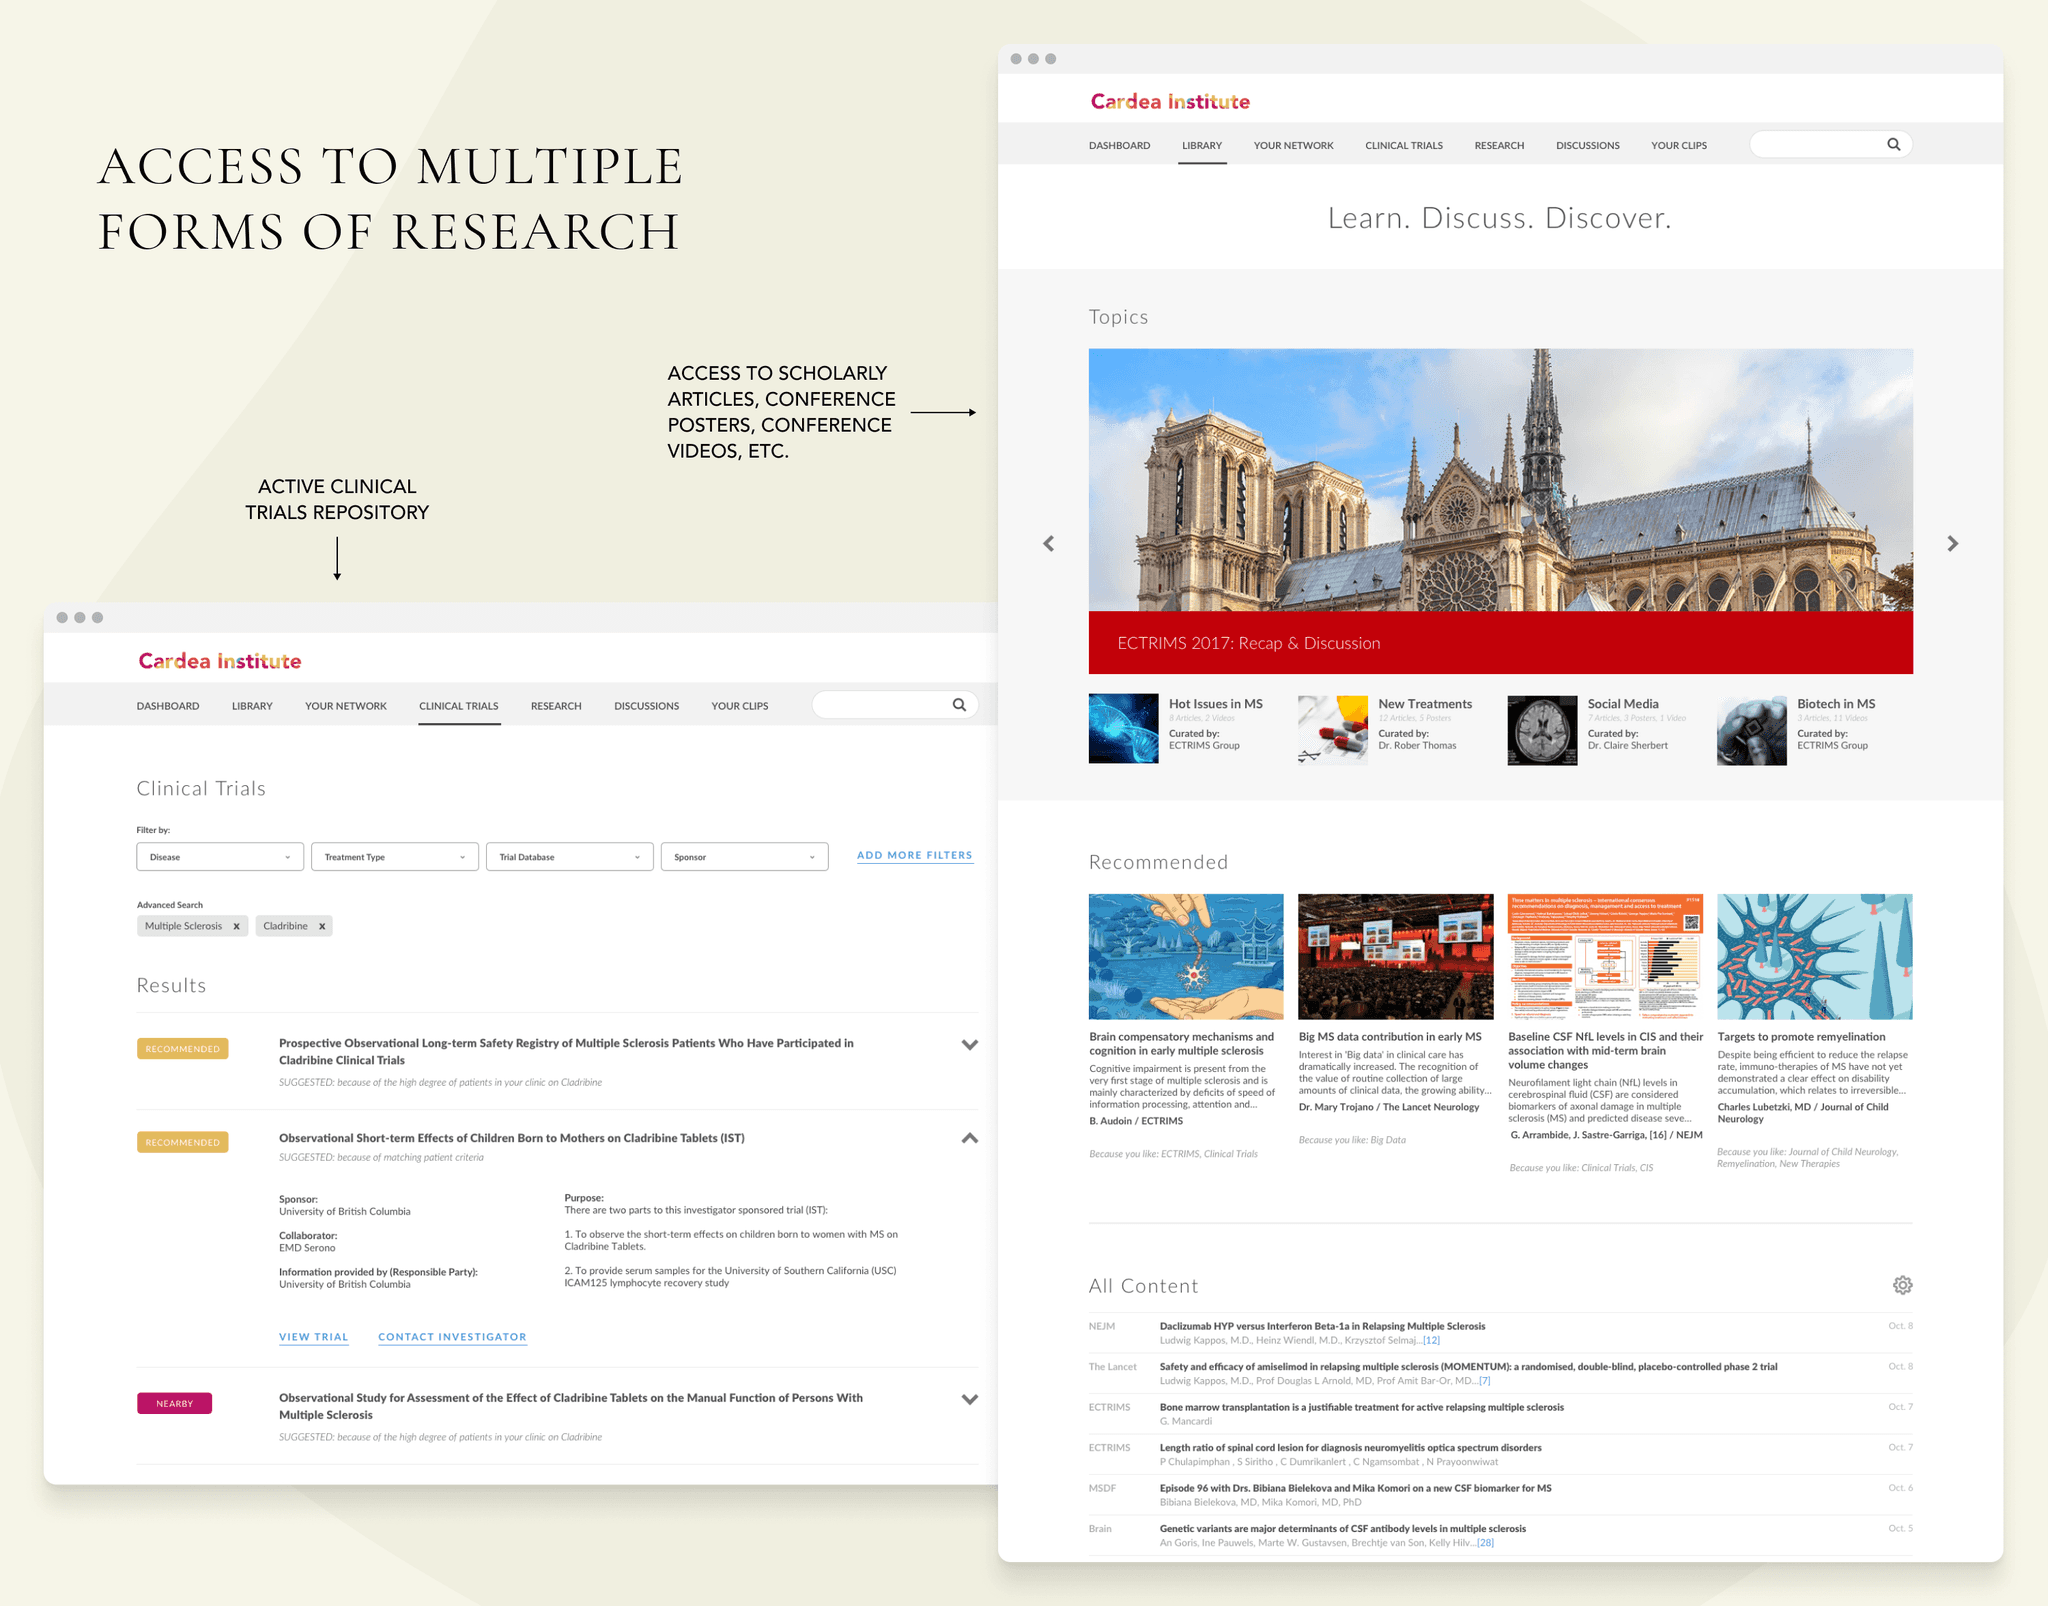
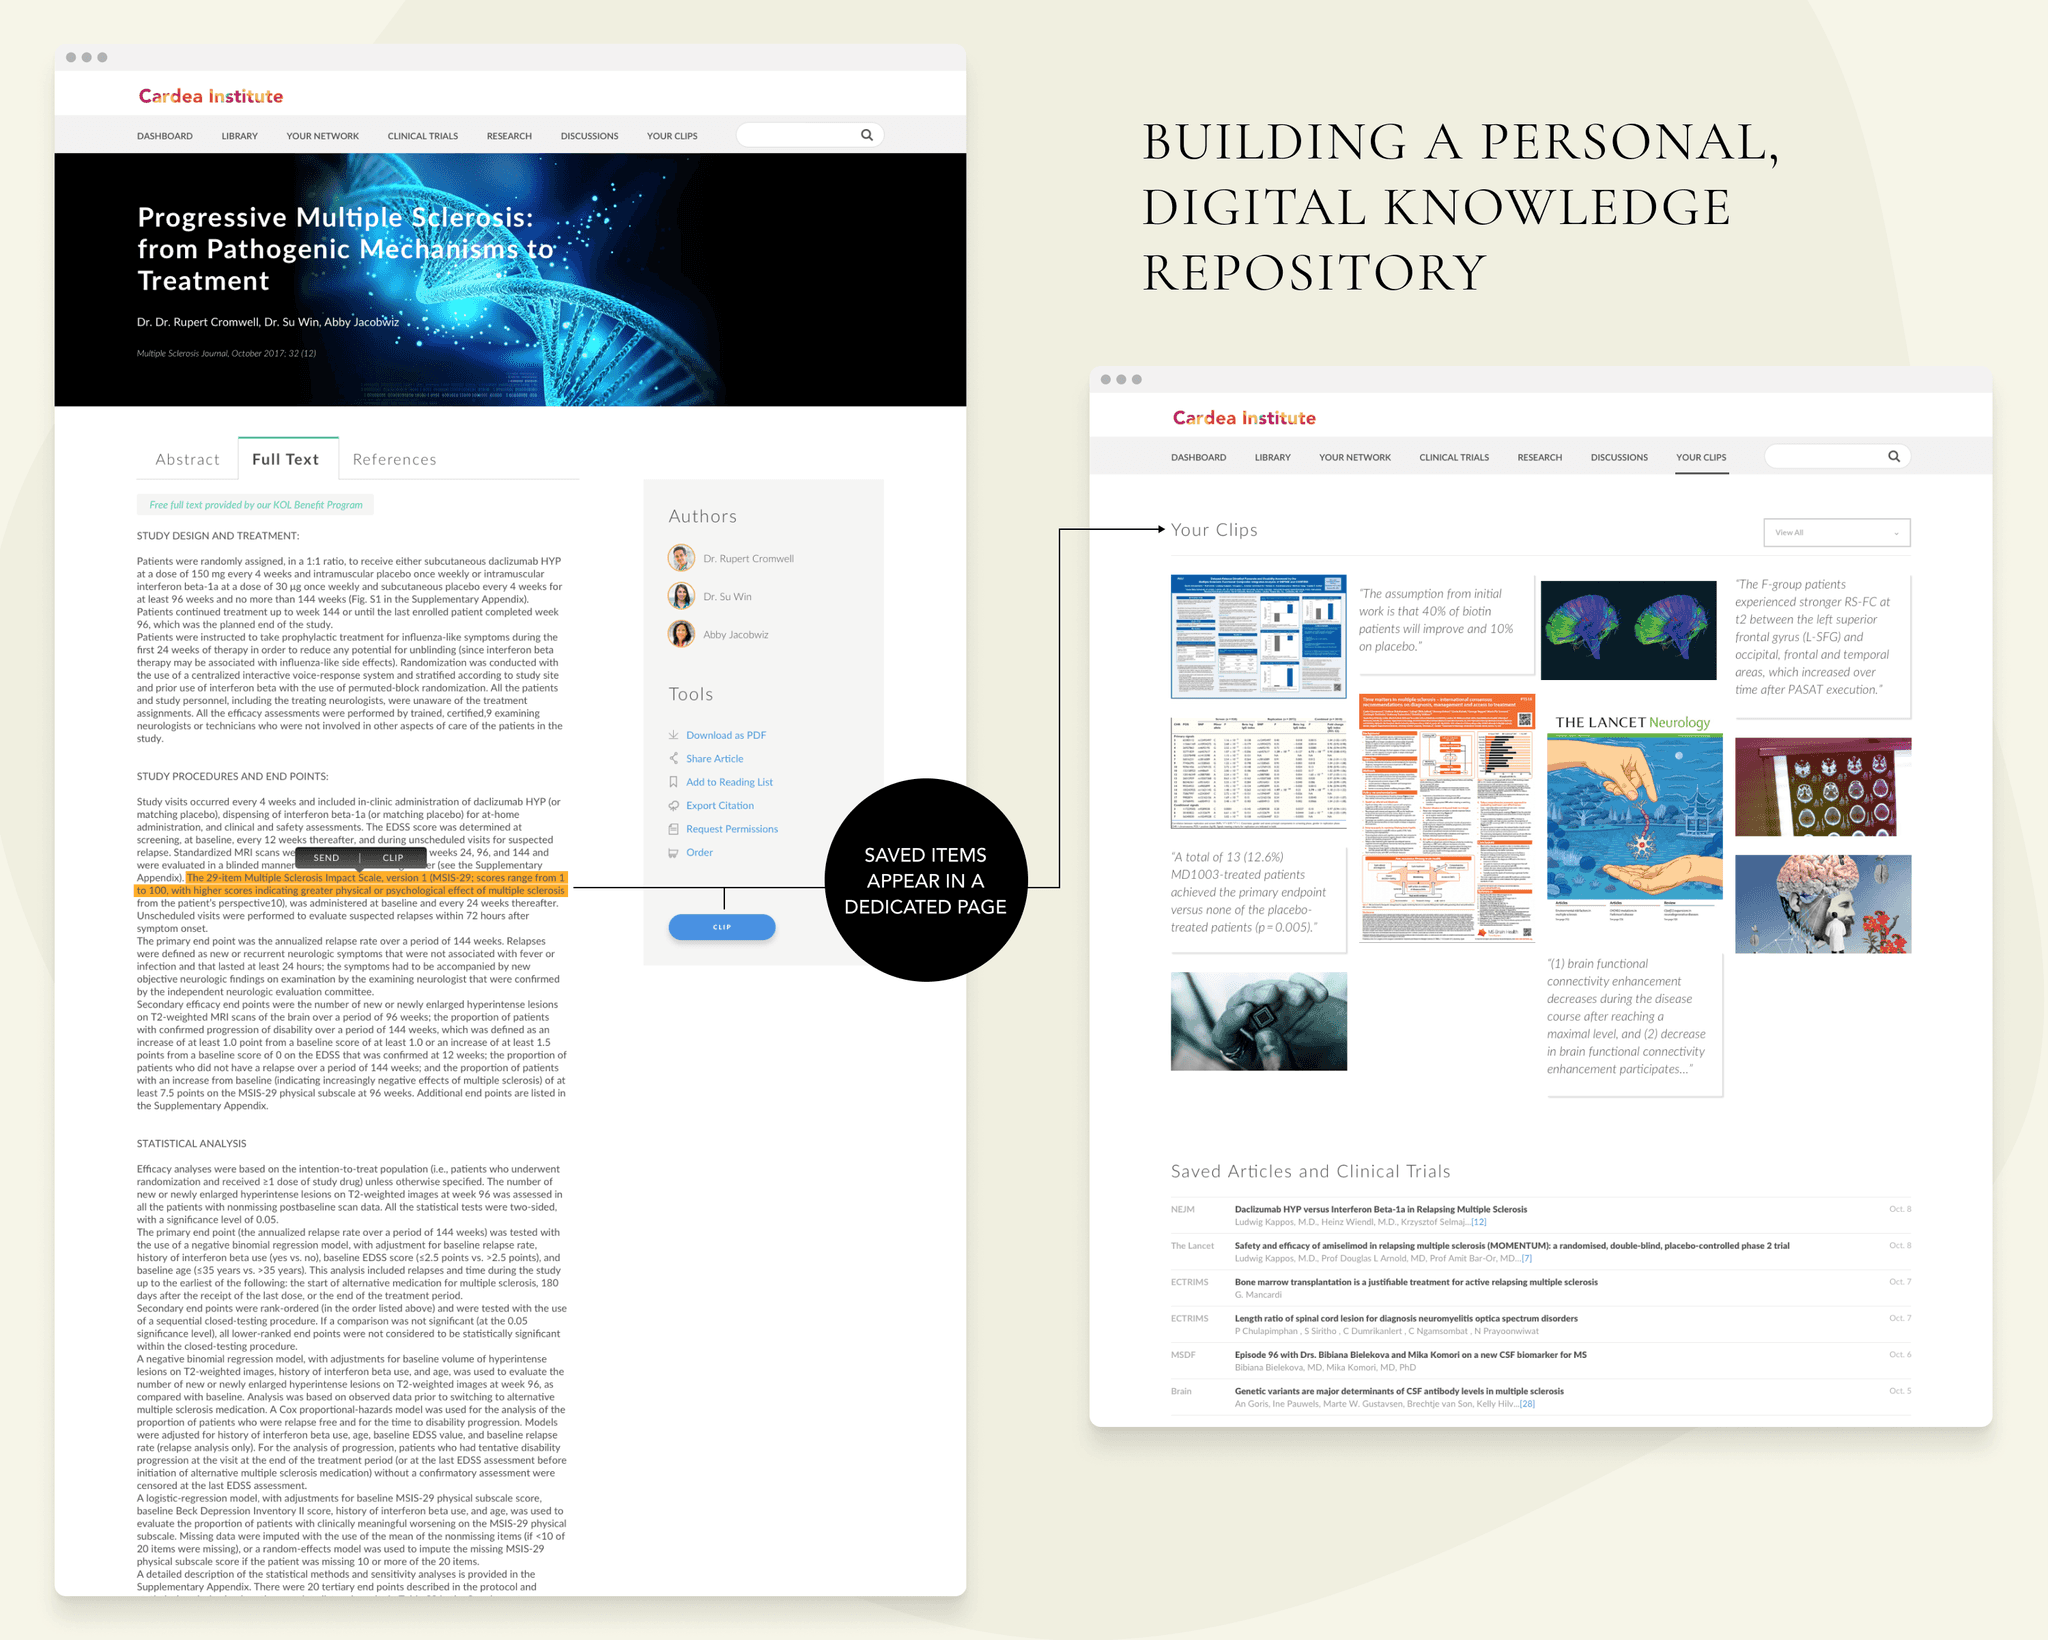
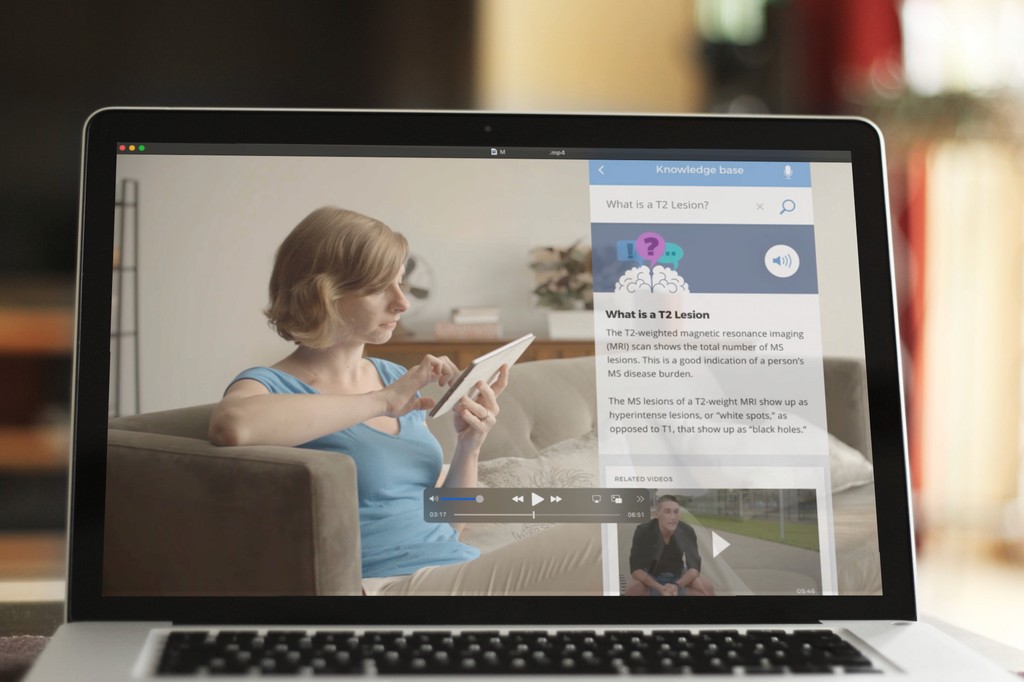
The team bundled the nine concepts into two distinct product offerings and built north star mocks, click-through prototypes, journey-based stories, and a marketing video to demonstrate to the client how these ideas could work together to solve different HCP pain points.
[IDEATE & VALIDATE PHASES]
Knowledge-Hub for High-Efficacy Neurologists
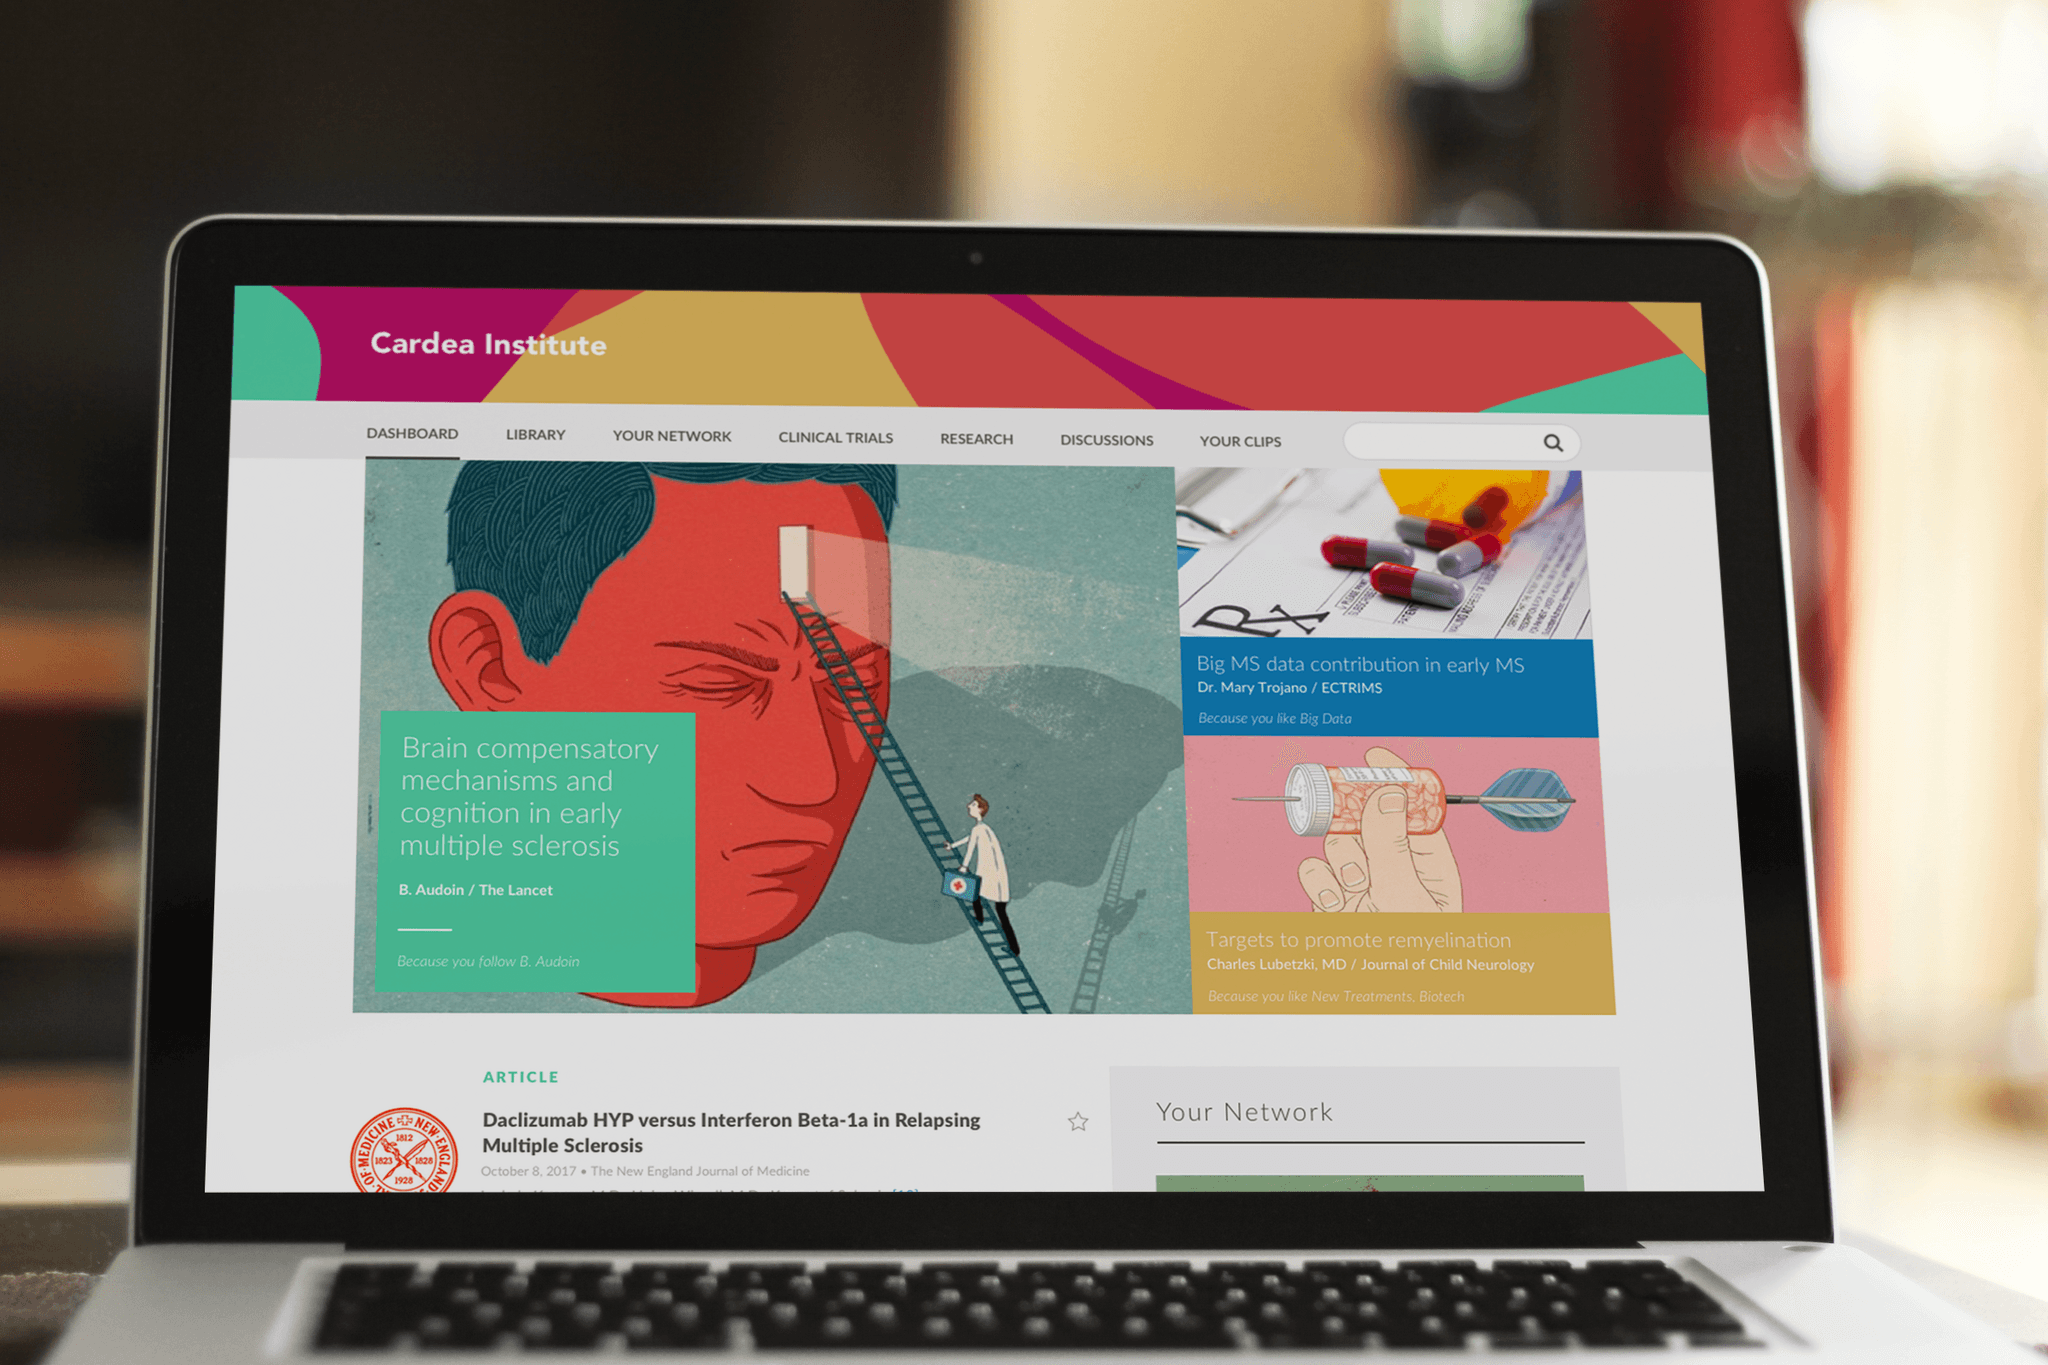
Splitting up concept coverage, I worked on generating a north star product targeting the High Efficacy Supporter and Follower segmentation types. Focused on the knowledge acquisition journey, I combined half of the nine "winning" concepts that dealt with ongoing education, peer to peer interaction, independent research, and direct exposure to pharma.
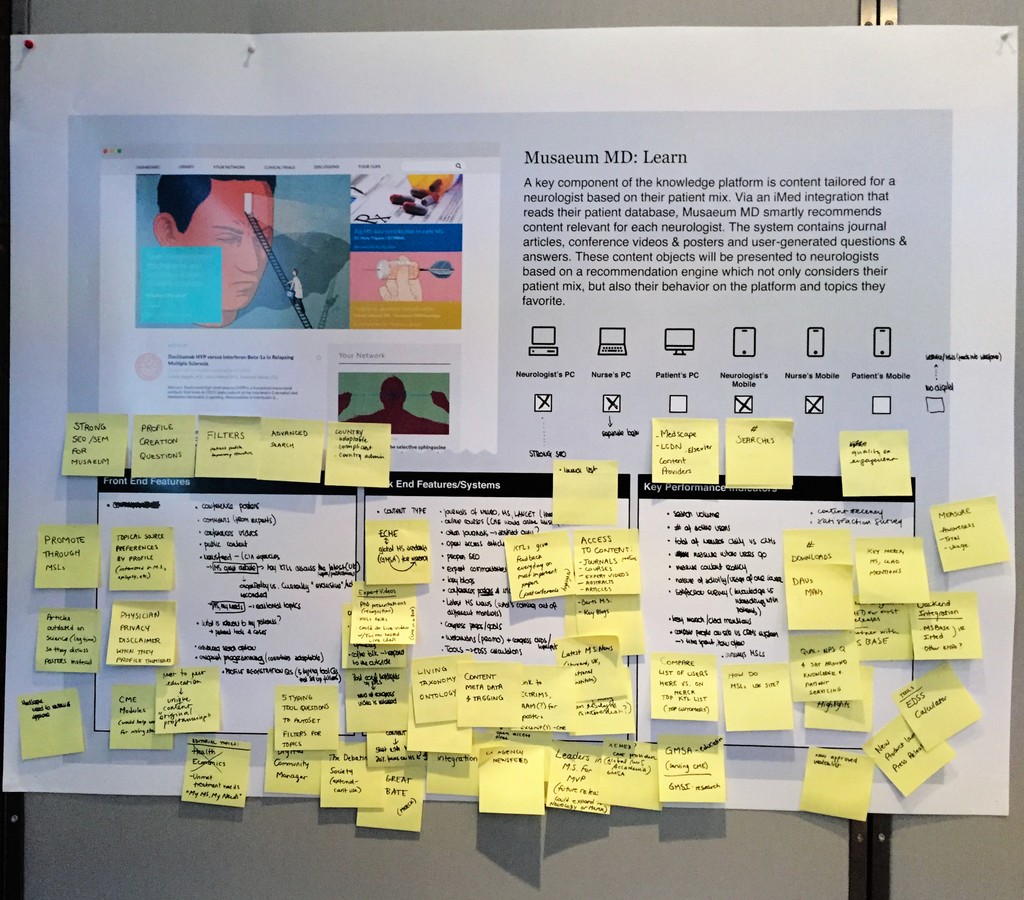
INITIAL CONCEPT IMPLEMENTATION PLANNING (WITH CLIENT)
[OPERATIONALIZE PHASE]
CLIENT HAND-OFF
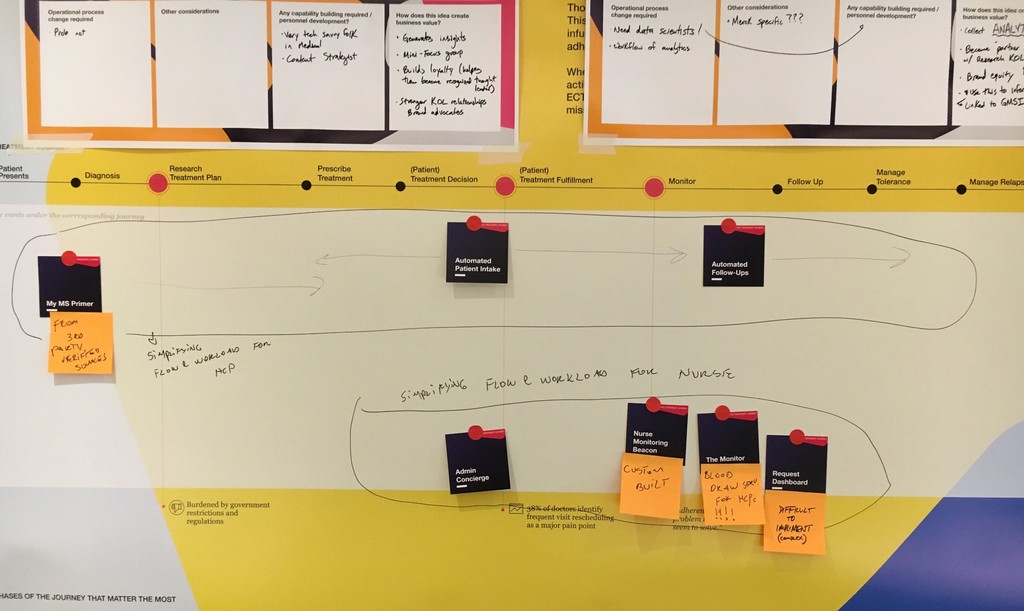
Our final workshop with the client included a series of high-level implementation activities for the clustered concepts. The goal wasn't to produce a final roadmap, but to help stimulate conversation on what would actually be achievable and meet their goal of increasing market share for their new MS treatment.
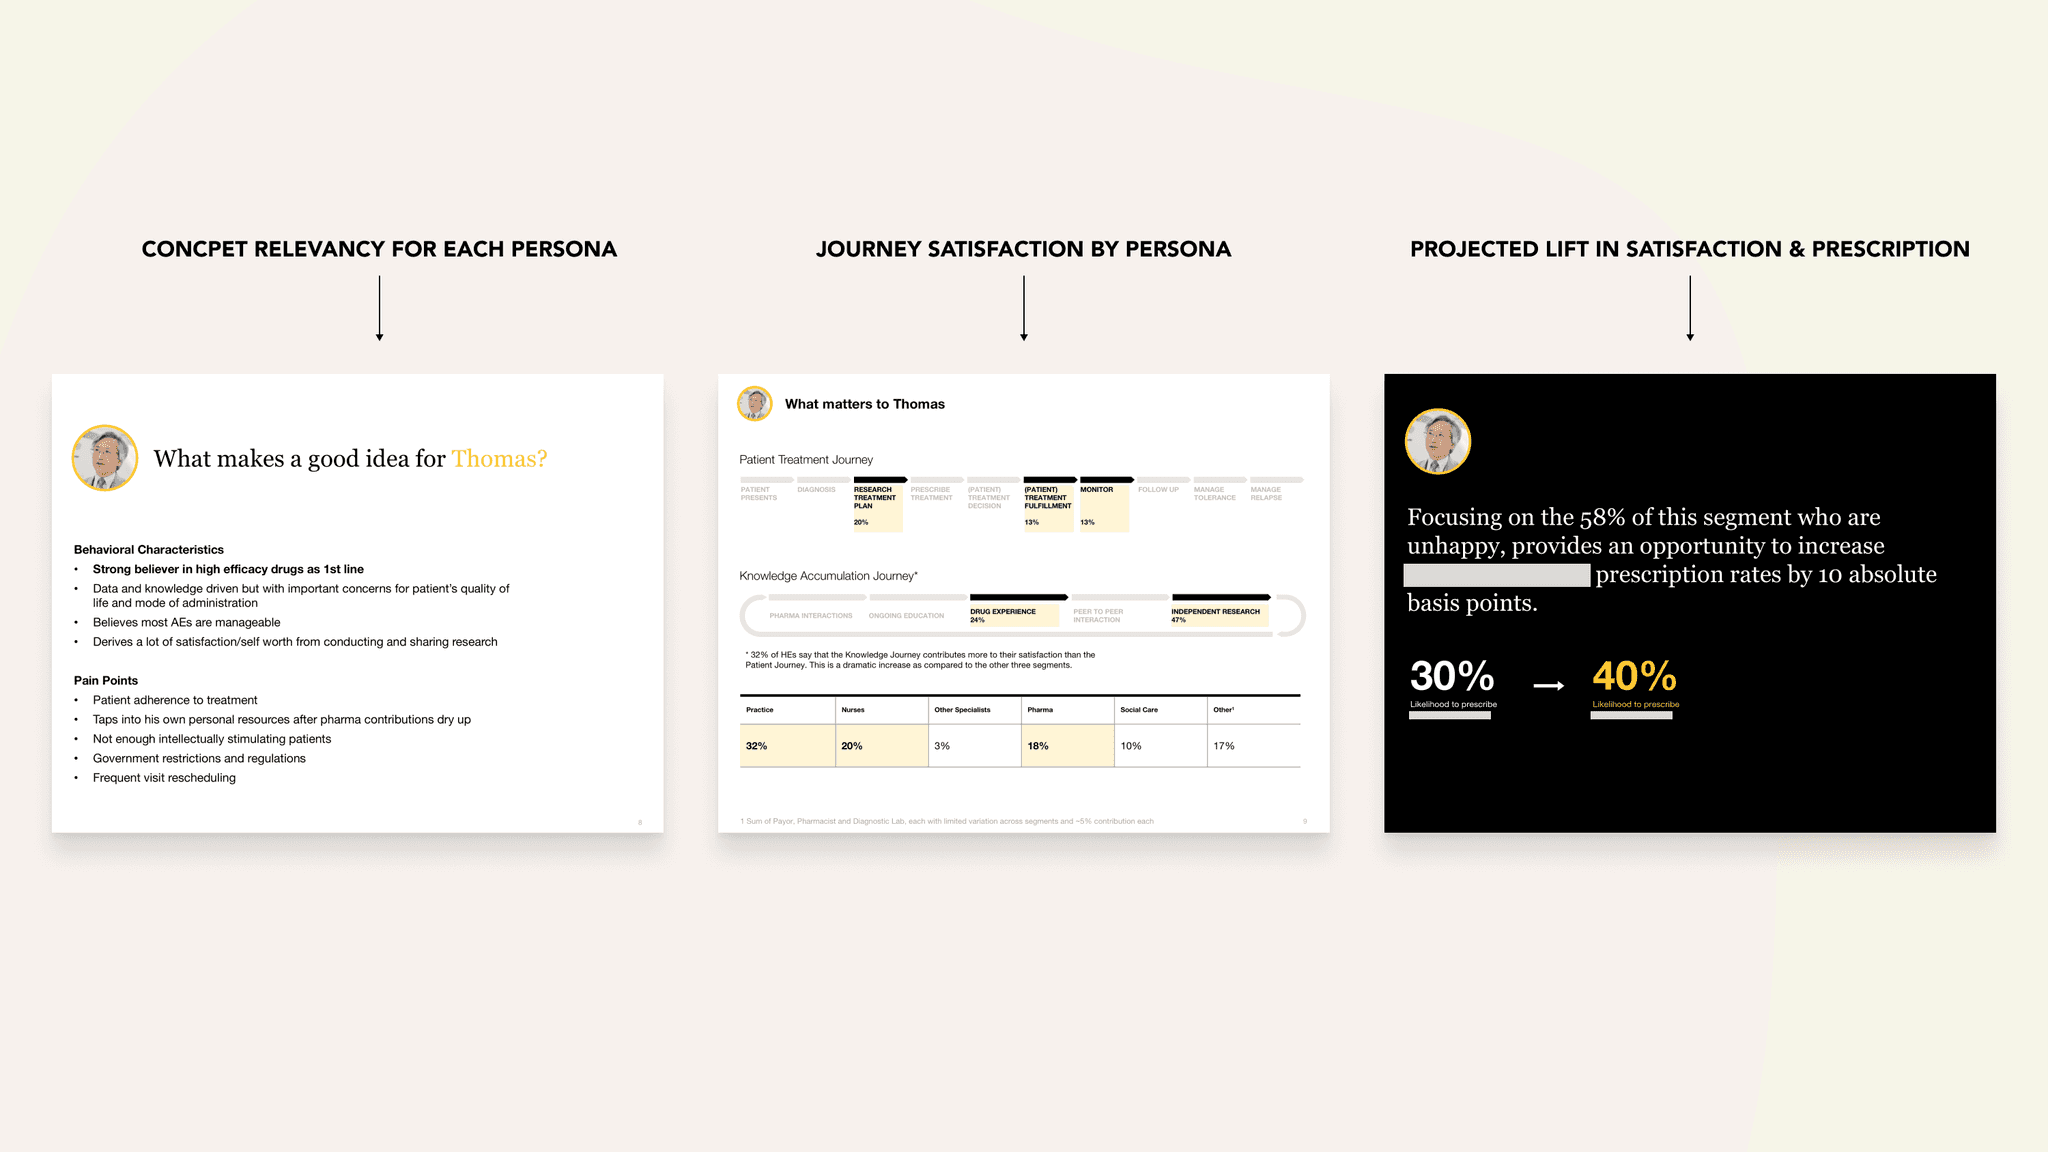
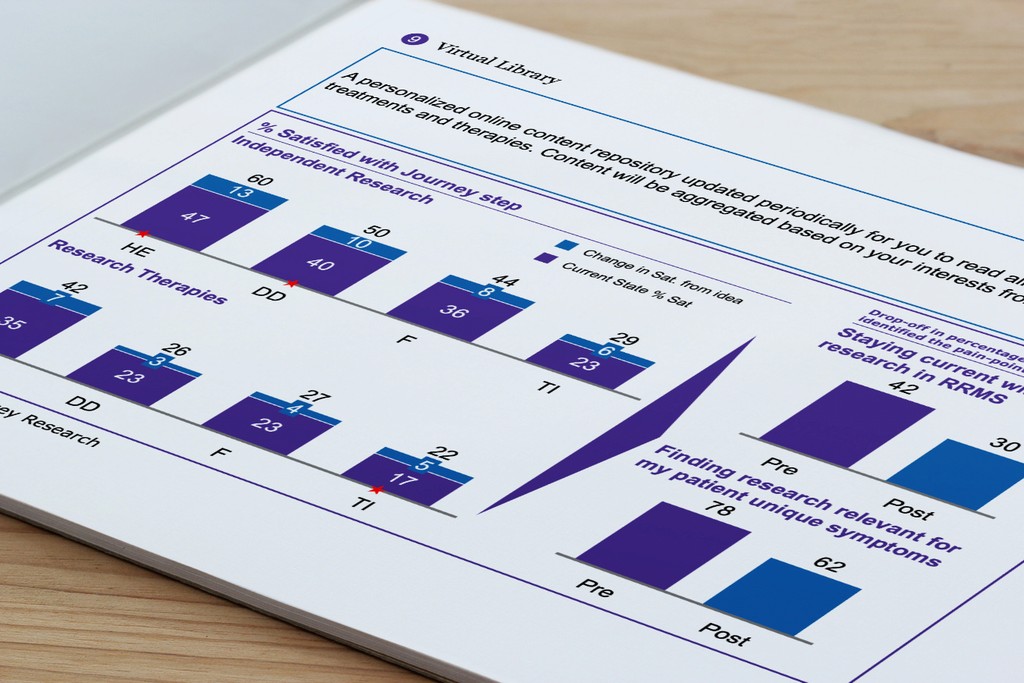
Additionally, we prepared handoff decks with summarized data analysis for each concept and correlated projection in "journey satisfaction lift" by segment type. To help the client with conversations with their own leadership, the McKinsey team wrote and produced a marketing video demonstrating what it could look like if the actual products were produced.
LEAVE BEHIND DATA ANALYSIS
CONCEPT VIDEO
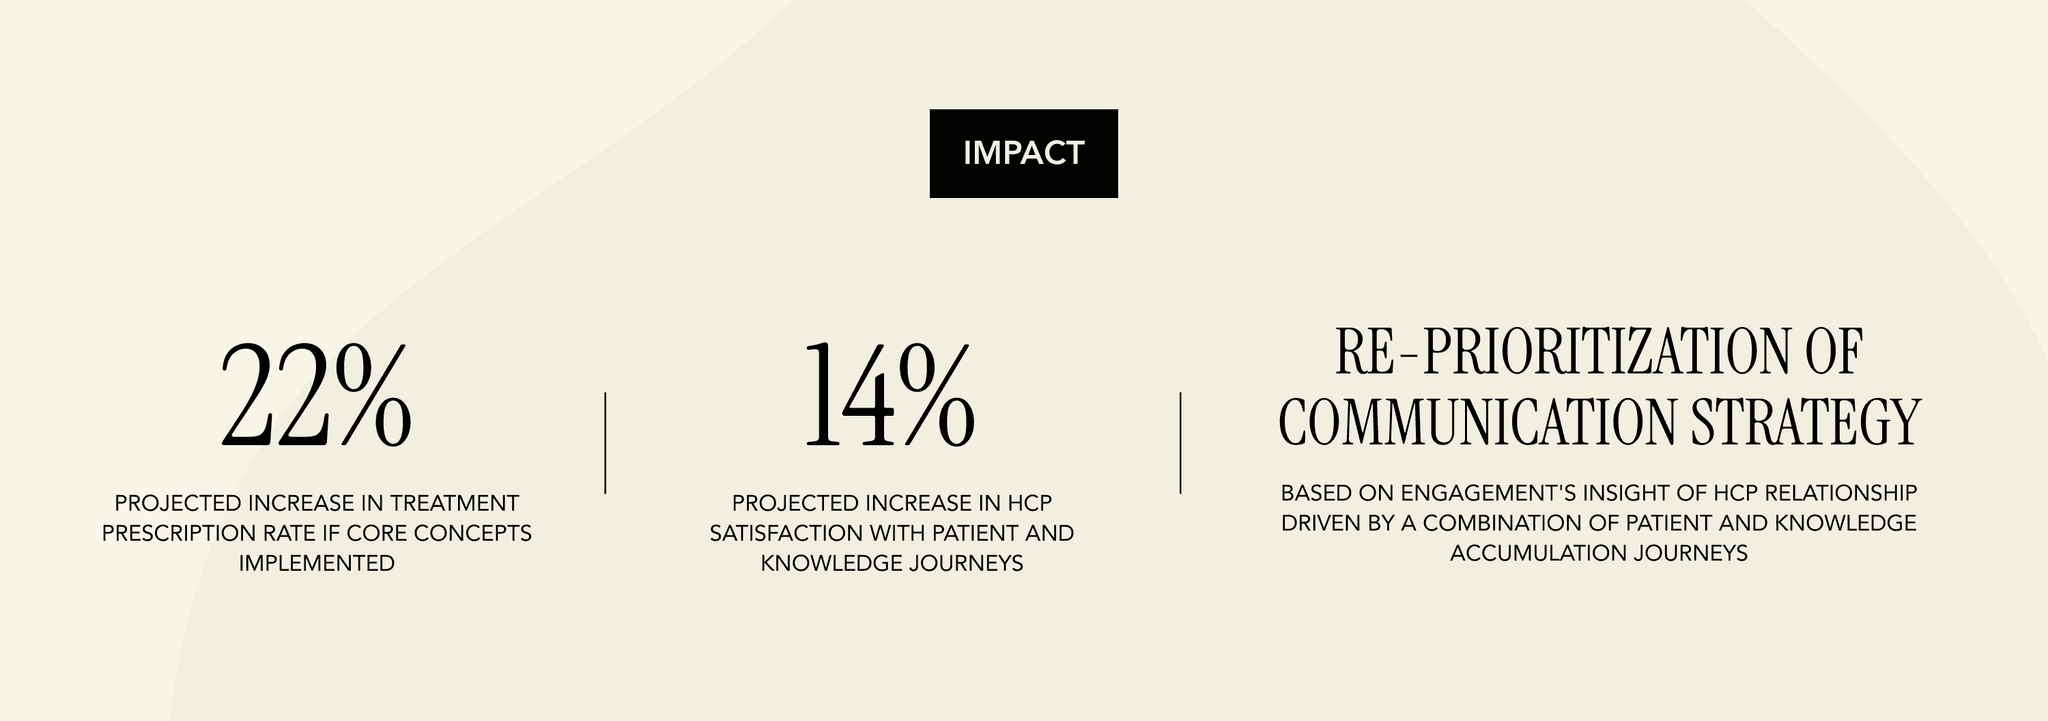
IMPACT
PROJECTED LIFT IN DRUG ADOPTION RATE BY NEUROLOGISTS TREATING MS, IF KEY CONCEPTS IMPLEMENTED
projected increase in hcp satisfaction with patient and knowledge journeyS
Client Re-prioritization of Communication Strategy
BASED ON ENGAGEMENT'S INSIGHT OF HCP RELATIONSHIP DRIVEN BY A COMBINATION OF PATIENT AND KNOWLEDGE ACCUMULATION JOURNEYS


