|
[SUMMARY]
One of Zelis' core products is the provider finder that sits inside of a health plan's digital portal. I led a team that stood up the advanced product analytics function, answering our client's call to help them better understand their members and our internal Product desire of building a continuous improvement process centered around an insights engine.
Being a B2B2B2C company and working on a white-labeled product introduced layers of complexity that extended the "work" into the realm of consulting. The desire for change was there, though: over the course of a year, we built out a nascent CX Insights team, shored up internal and external relationships, and launched the MX Index: standardized member experience scores and insights at both the global and individual client level.
|
[ROLE]
Director of Design
Insights & Empowerment, BU
|
[COMPANY]

70M
member coverage
18.9K
respondents
660
UXR participants
9.7K
feedback responses
SECTION 1
// PARTS //
01: Fragmented CX Insights
02: Building a New Model
[01]
FRAGMENTED CX INSIGHTS
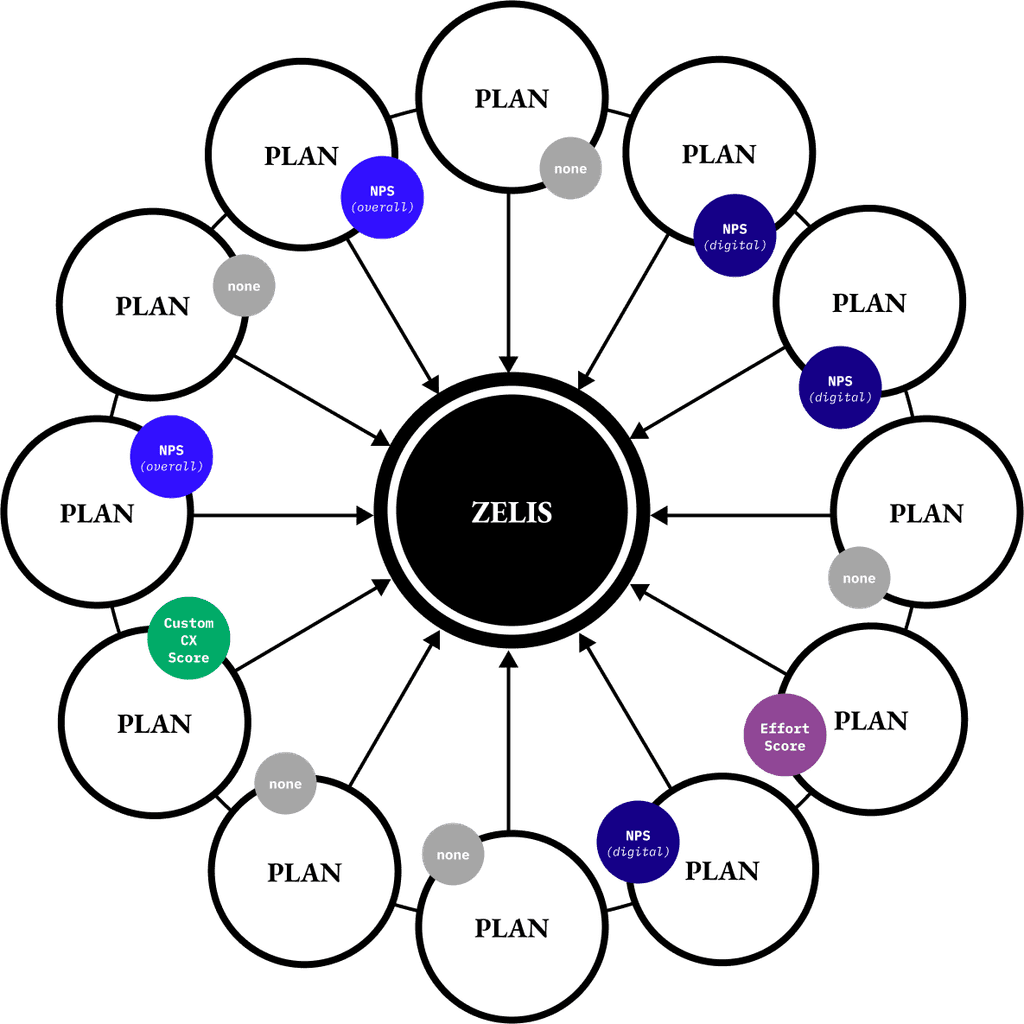
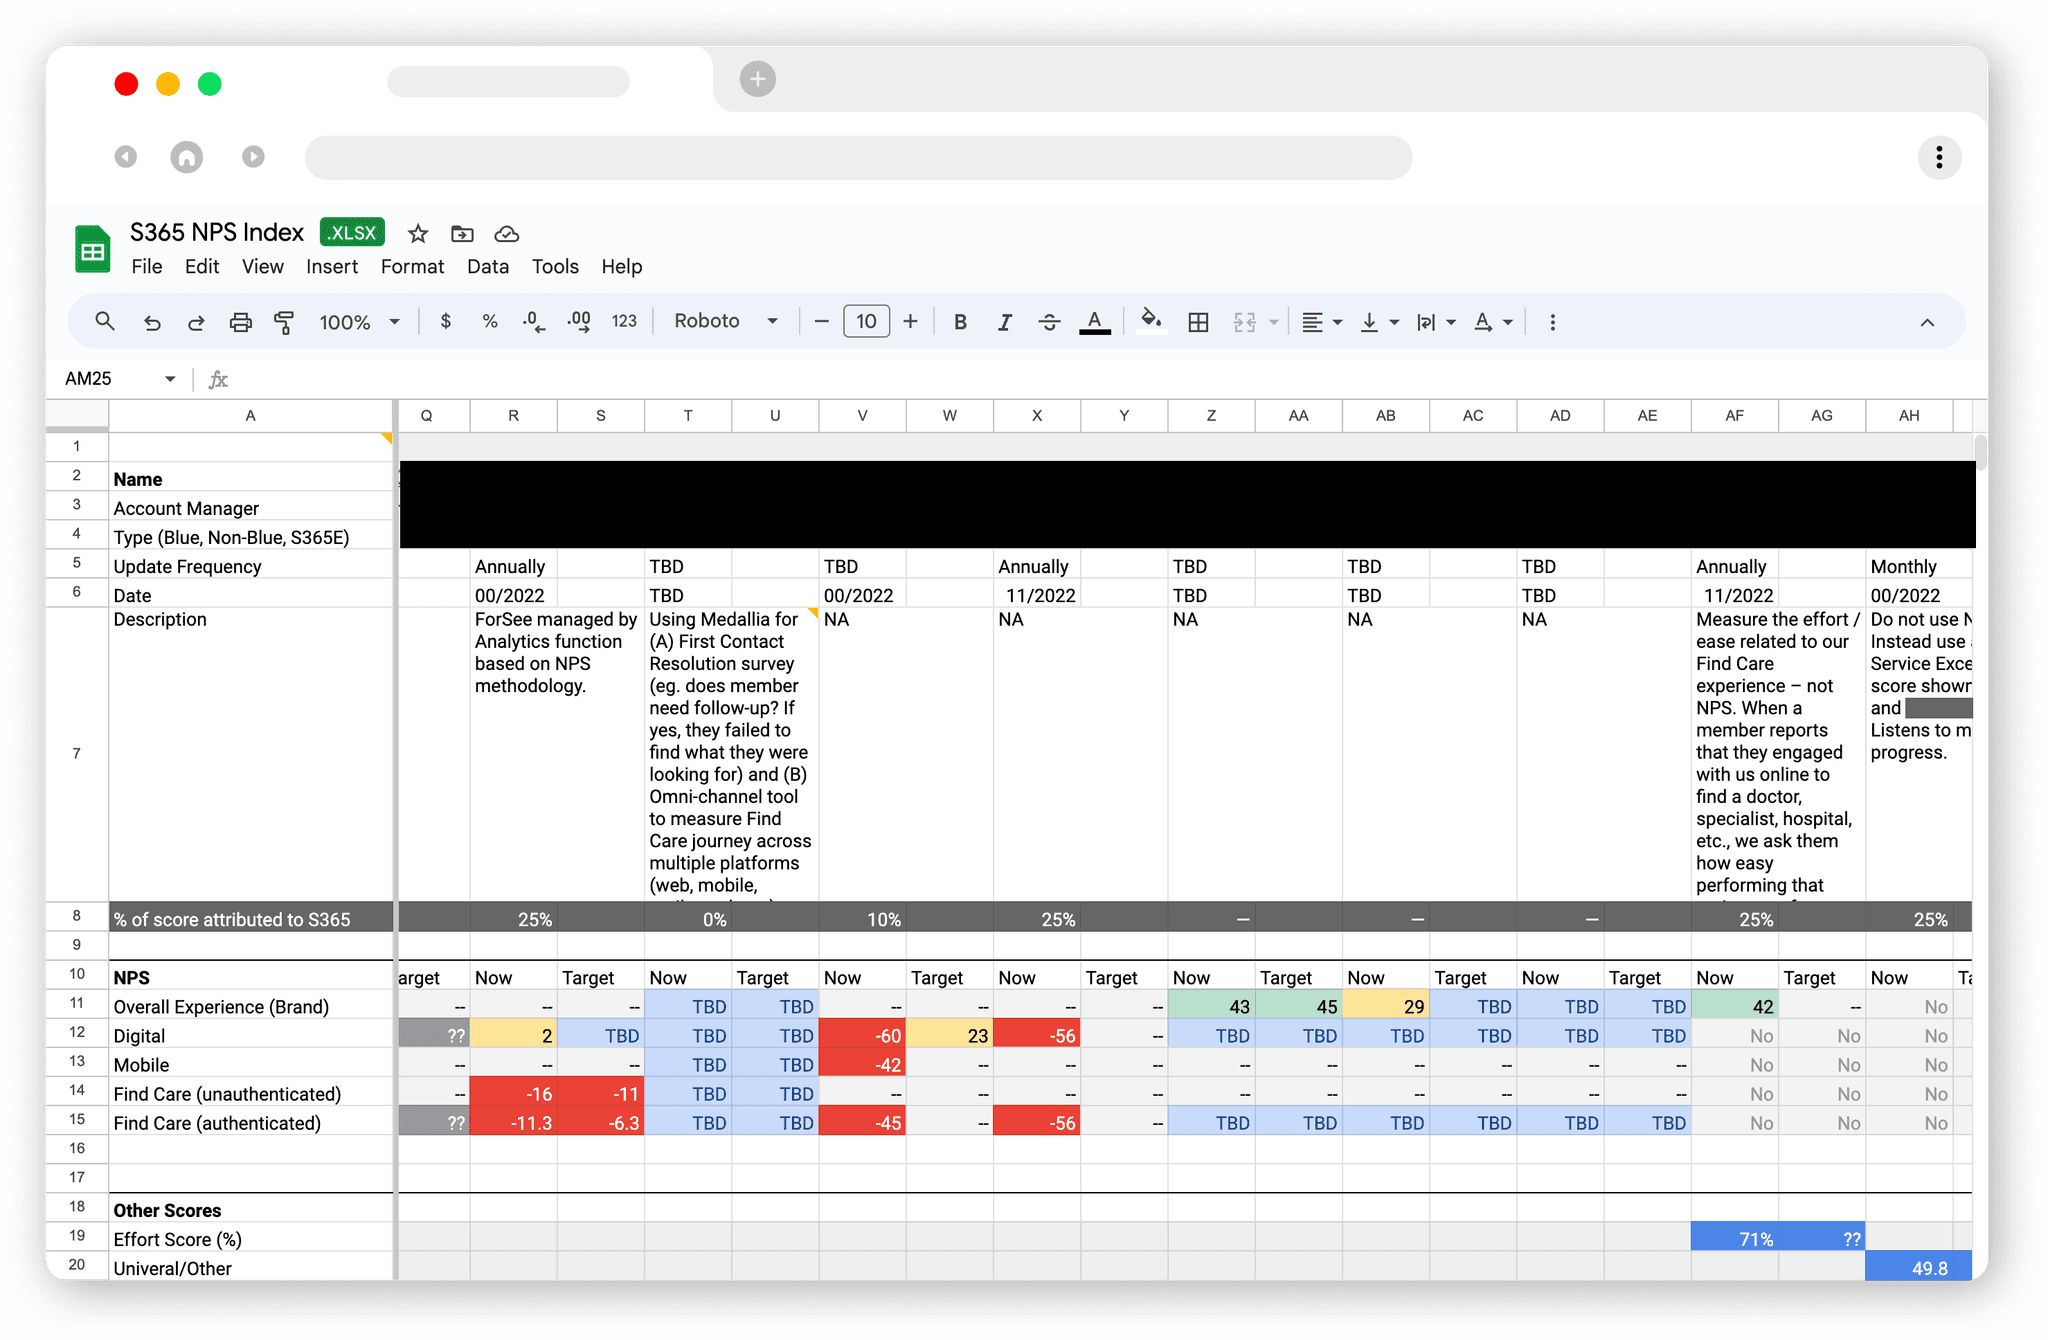
CX measurement driven by clients, a lack of consistent methodology, and the reinforcing of a professional services driven product culture.
[fig. 2] The initial MX Index was a Google spreadsheet of all the scores that clients provided us, as well as available industry scores from competitors.
[02]
BUILDING A NEW MODEL
Connecting member goals to micro-journeys and launching one methodology for all clients.
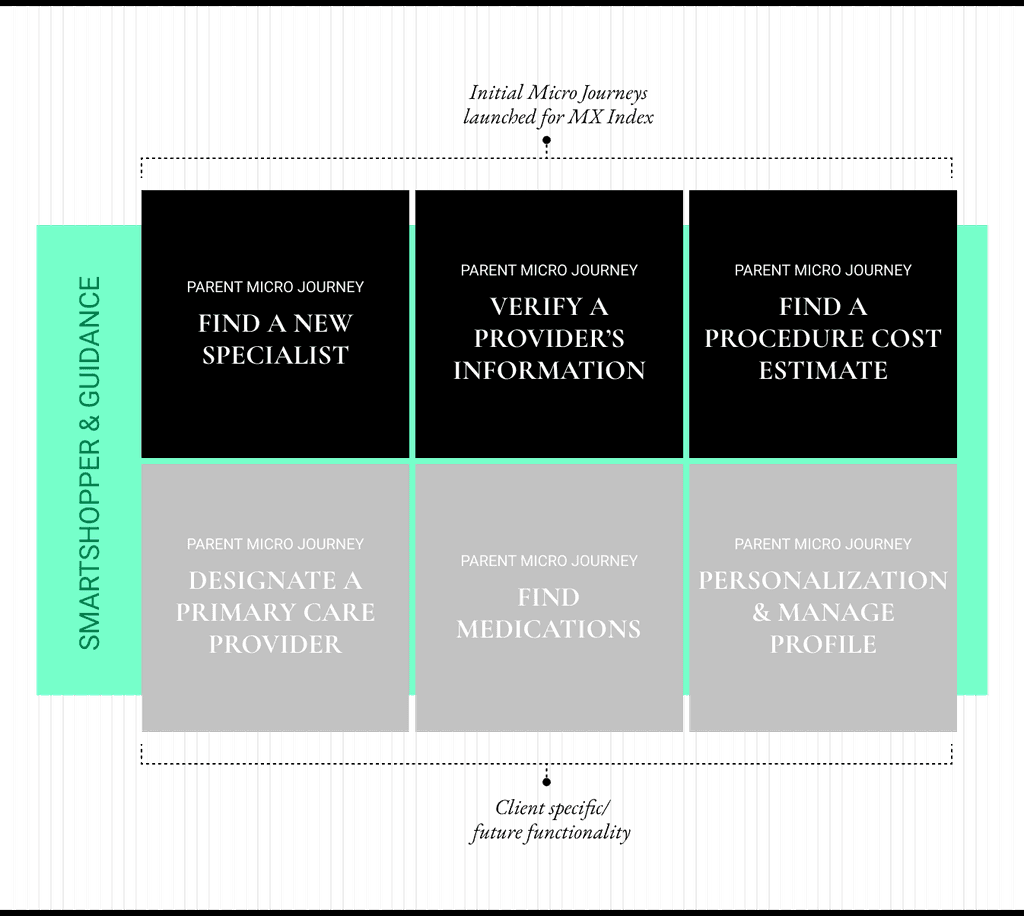
[fig. X] The top three micro-journeys accounted for XX% of total traffic, while ones like “designate a PCP” or “find medications” were client specific as those features were add-on.
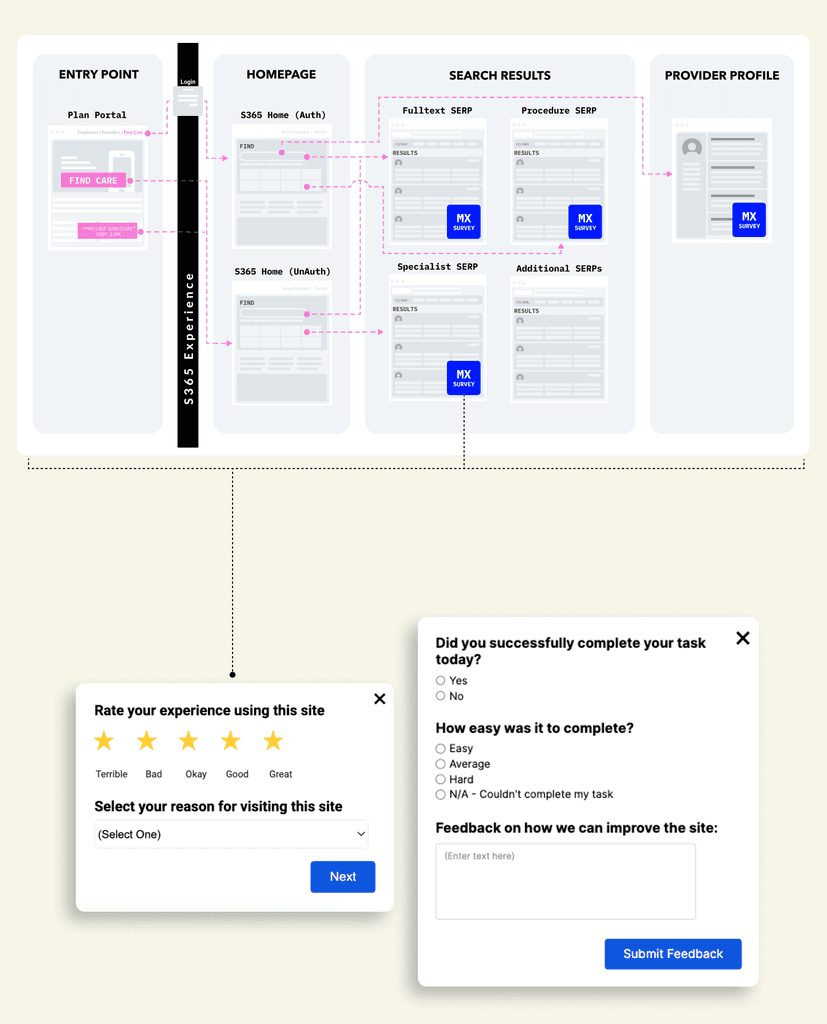
For each micro-journey we wanted to measure and collect information in context of what we thought a member was trying to do. We structured our surveys to collect:
Customer Satisfaction [CSAT]: captured on a scale of 1-5
Customer Effort Score [CES]: easy / average / hard / N/A
Goal Completion Rate [GCR]: yes / no
Member feedback in context of what they were trying to accomplish
The initial surveys triggered on different pages in the experience, which we connected to assumed member intent. For instance, if a member was on the procedure search result page we think they were trying to find a cost estimate. Eventually, we want to move away from page-based triggers and instead have them connected to specific feature usage.
Another goal is to get to deeper segmentation of member experience along a single micro-journey. It’s great to have overall CSAT and GCR scores for members looking to find a specialist, but it’s even more valuable to have CSAT and GCR scores for authenticated versus unauthenticated members looking for a specialist; for members with a PPO versus HMO, in rural versus urban setting, etc etc.
[fig. X] The top three micro-journeys accounted for XX% of total traffic, while ones like “designate a PCP” or “find medications” were client specific as those features were add-on.
[fig. X] This diagram became one of the most helpful aides for both internal and external conversations around how updates to the product were dependent on collaboration between the teams.
[03]
CLASSIFYING MX ISSUES
Creating a framework for classifying MX issues, connecting them to levels of member dissatisfaction, and assigning ownership.
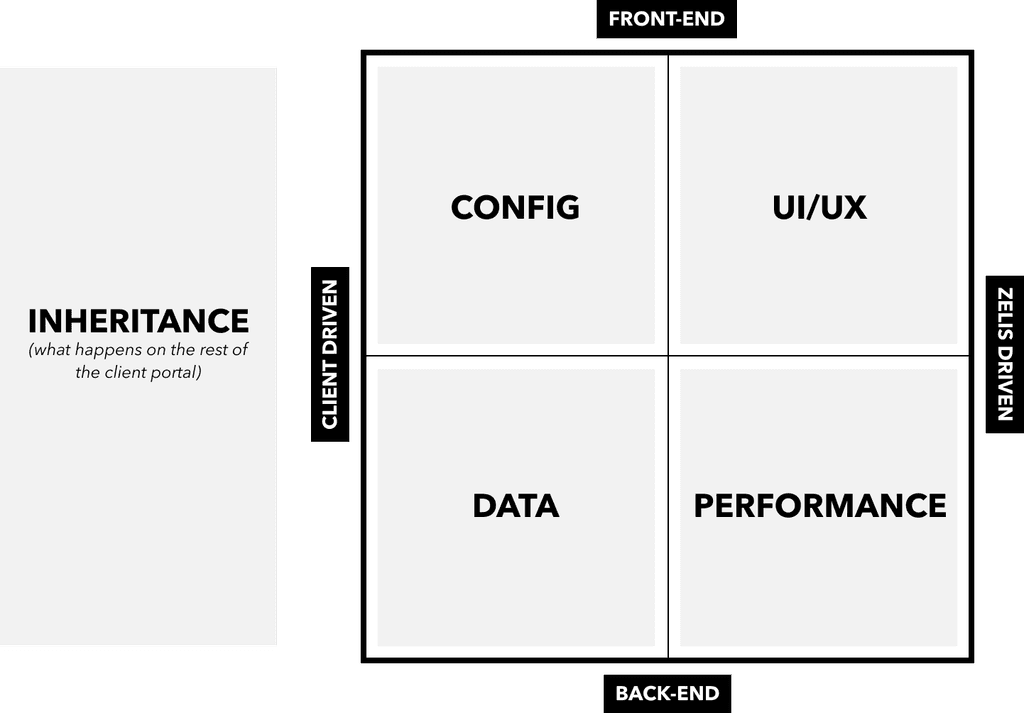
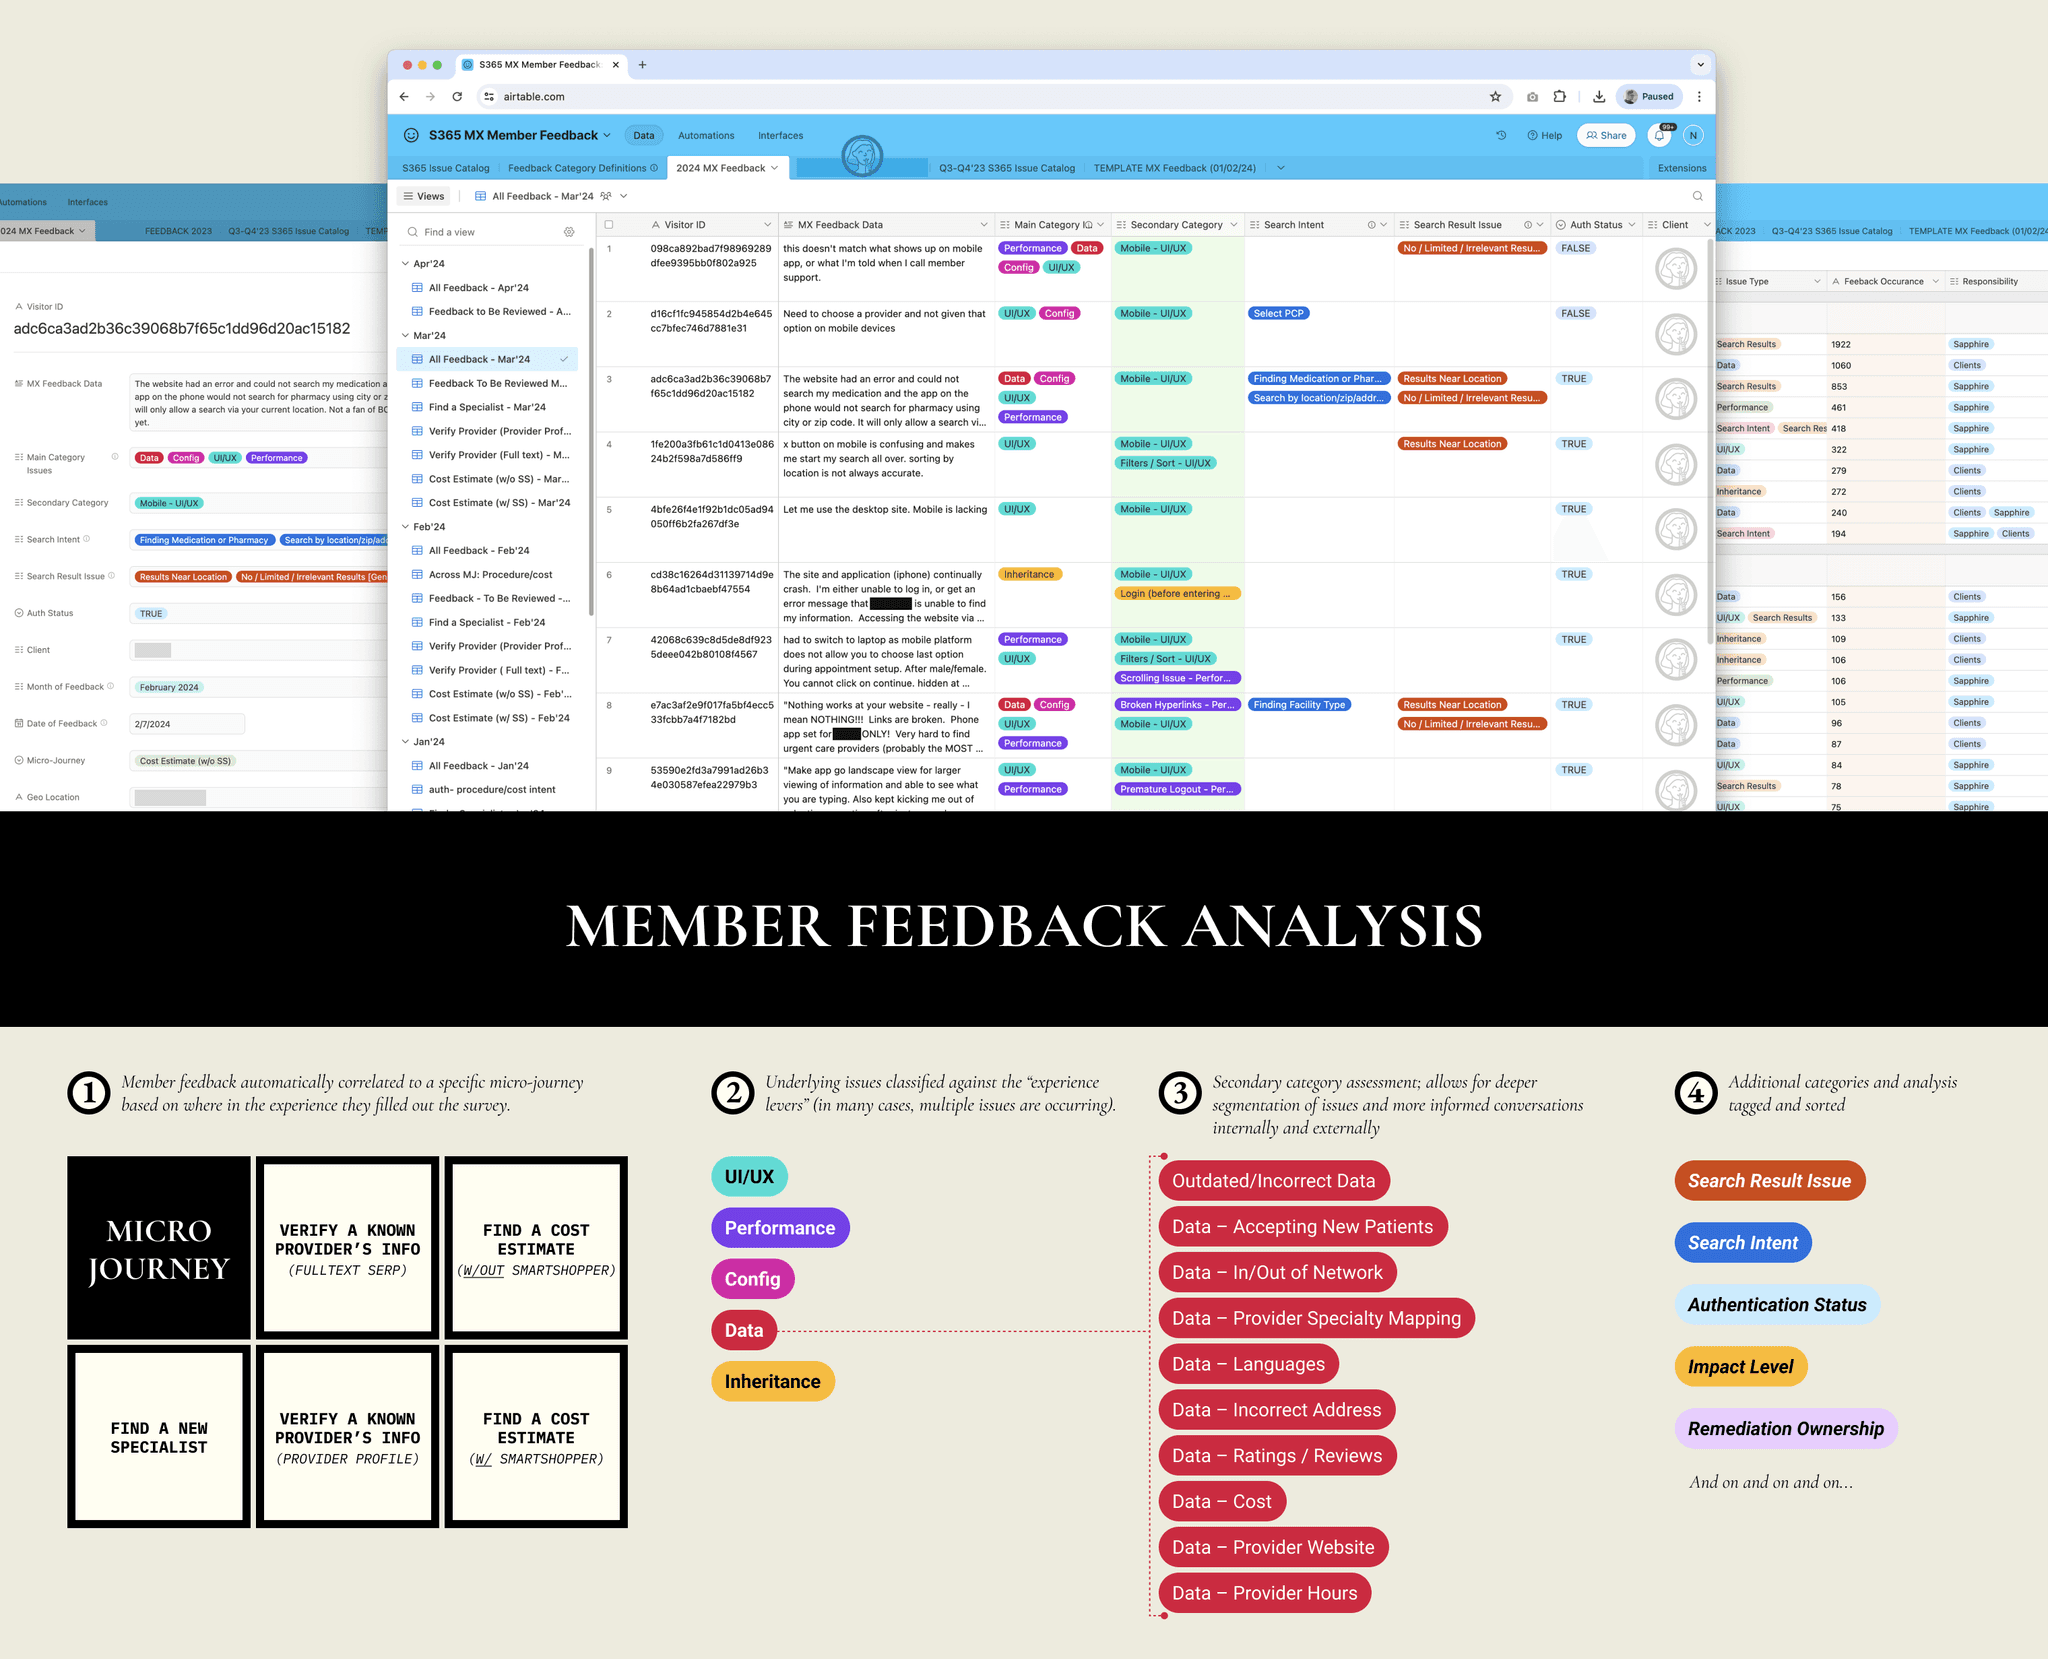
The experience of our provider finder tool (like many products) is comprised of five separate, yet interconnected levers: the UI/UX, the front and backend performance, configuration decisions, data, and "inherited" member experience moments based on their experience in the rest of the client's portal.
All of these need to be optimized in conjunction to deliver broader MX improvements, but what the MX Index allowed us to do was target individual micro-journeys and isolate specific levers for analysis. This is important since "ownership" of improvements rests either on Zelis' side, in the case of UI/UX and performance updates, or on the clients for data improvements and configuration decisions. It's a balance: driving delivery across vendor and client, but being able to see how together those updates coalesce into a singular experience for the end member.
For context, we defined the levers and their related issues as:
INHERITANCE ISSUES: Issues impacting member satisfaction with the provider finder experience before entry into S365.
EXAMPLES: SSO payload load time, portal placement and visibility.
UI/UX ISSUES: The components, information hierarchy, content layout, or general accessibility of a page design impacting a user’s ability to accomplish their goal(s).
EXAMPLES: Location and network parameters being hard to discover on the homepage, color contrast issues with the text.
DATA ISSUES: Data displayed within the UI components (both local and national) is either out of date, incorrect, or poorly formatted.
EXAMPLE: Out of date accepting-new-patient data for a provider.
CONFIGURATION ISSUES: Config decisions related to feature functionality, messaging, or things like specialty mapping
EXAMPLE: Business reason to not display OON providers in result set, suboptimal specialty keyword mapping, confusing banner language.
PERFORMANCE ISSUES: Issues with overall application performance from a code perspective (can be related to SLA and impacting SLOs and SLIs).
EXAMPLES: Latency issues, data won’t load, etc.
SECTION 2
PARTS
04: Getting to Buy-in
05: Launch & Scaling
[04]
GETTING TO BUY-IN
Aligning clients and demonstrating the benefit of our methodology.
A layer of complexity to launching the MX Index was that several clients had preexisting surveys across their portal, often in their implementation of the provider finder. Likewise, there were cases where one in-house CX team captured member data and a separate group would be on the hook for analysis and insight generation.
One of the core benefits for clients moving off their own version of MX capture to the MX Index, was that they'd be able to compare their scores across levers against a baseline. Was their micro-journey score for "find a specialist" lower or higher than other health plans? Did they seem to have more data related complaints from members compared to their peers? This type of information could help with their own internal product and data roadmaps beyond the provider finder.
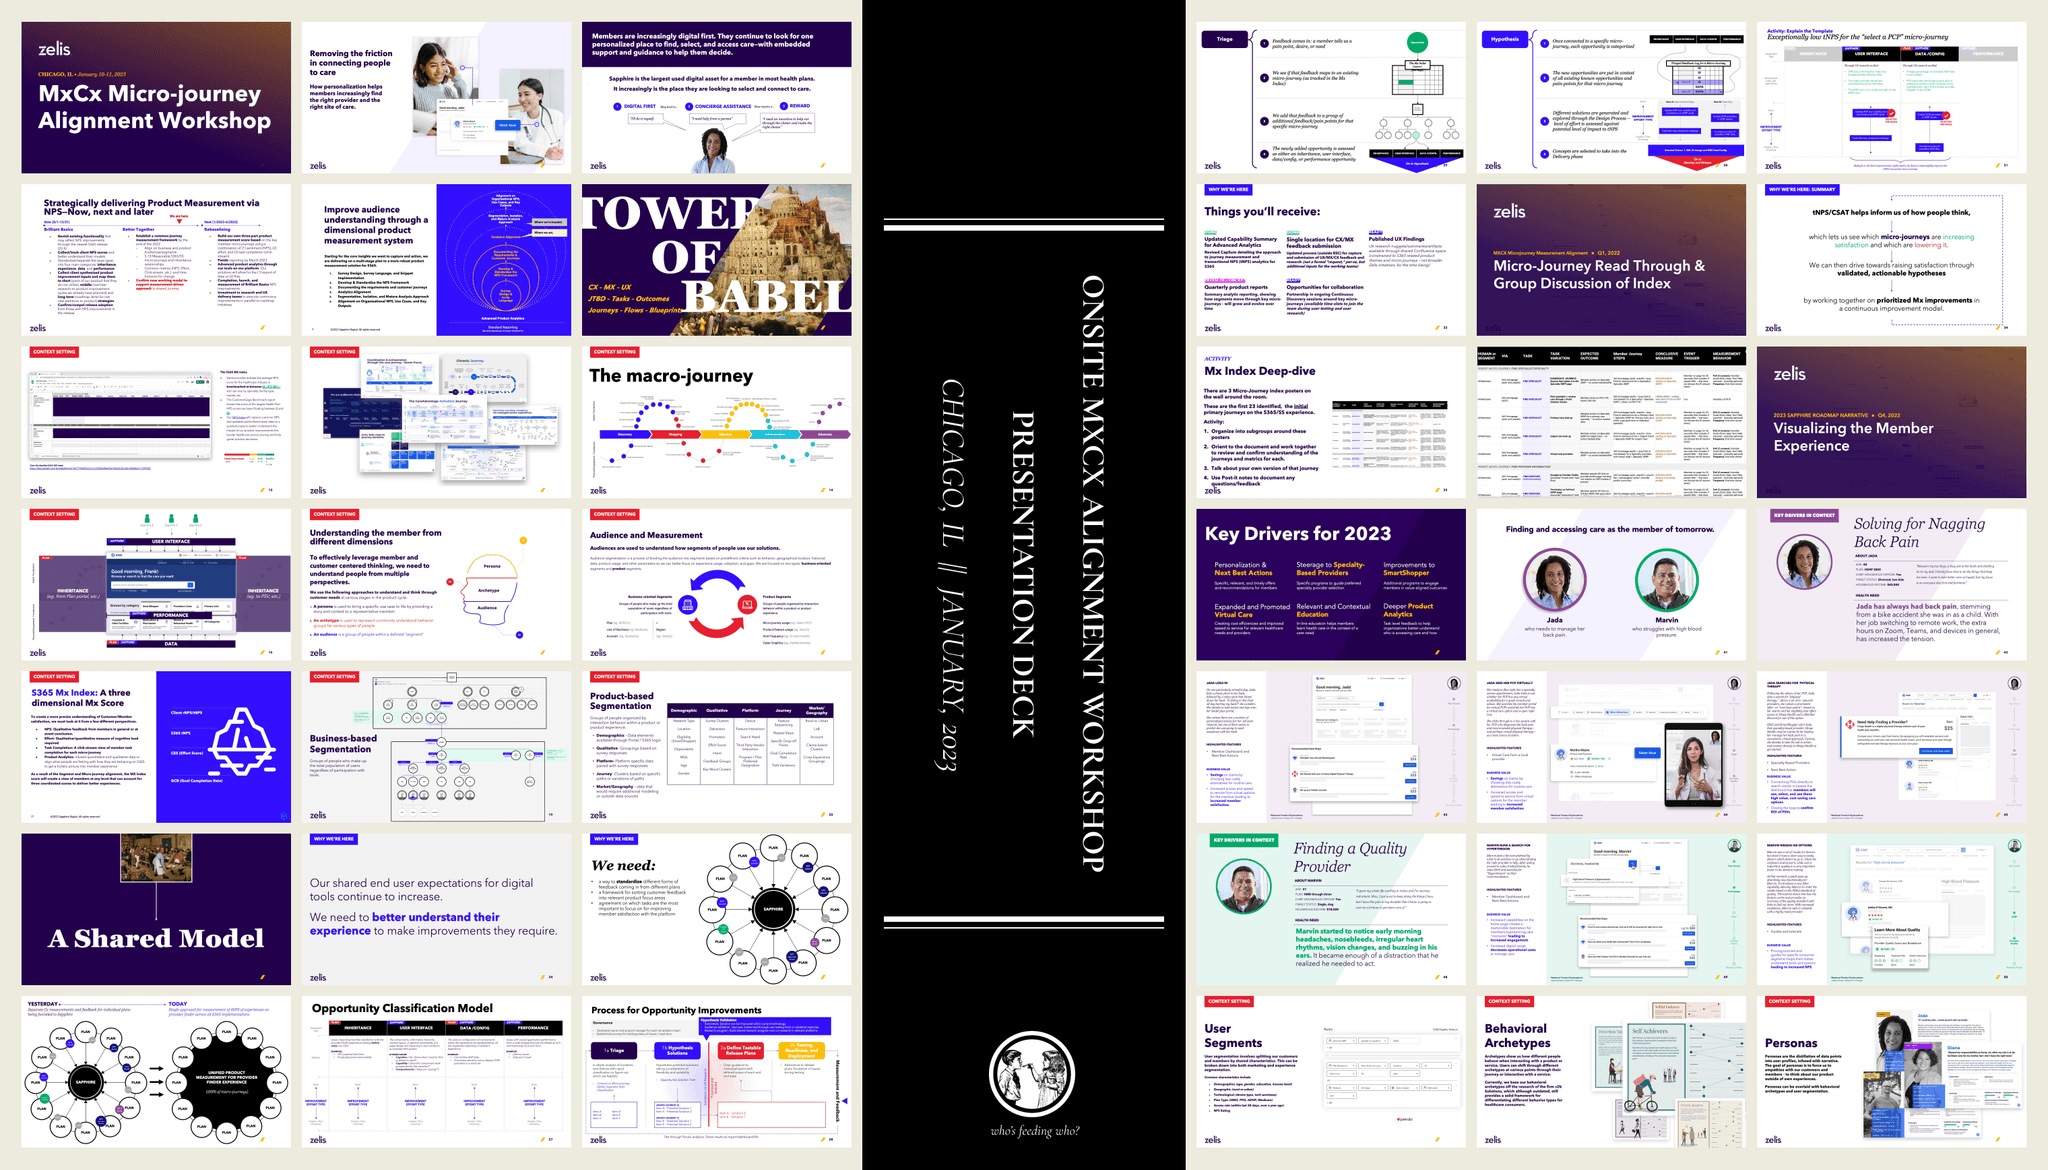
To generate momentum, we held an in-person workshop with six large clients who historically had been the most leaned into MX and demonstrated a willingness to pilot new methodologies. [fig. X]
The workshop helped us clarify our initial approach, lock-in pilot partners, and standardize a set of requirements for health plans that wanted to be on the MX Index:
removal of any existing survey functionality in a client's implementation of the provider finder
acknowledgement that the surveys were core: text, scoring methodology, and placement were non-configurable
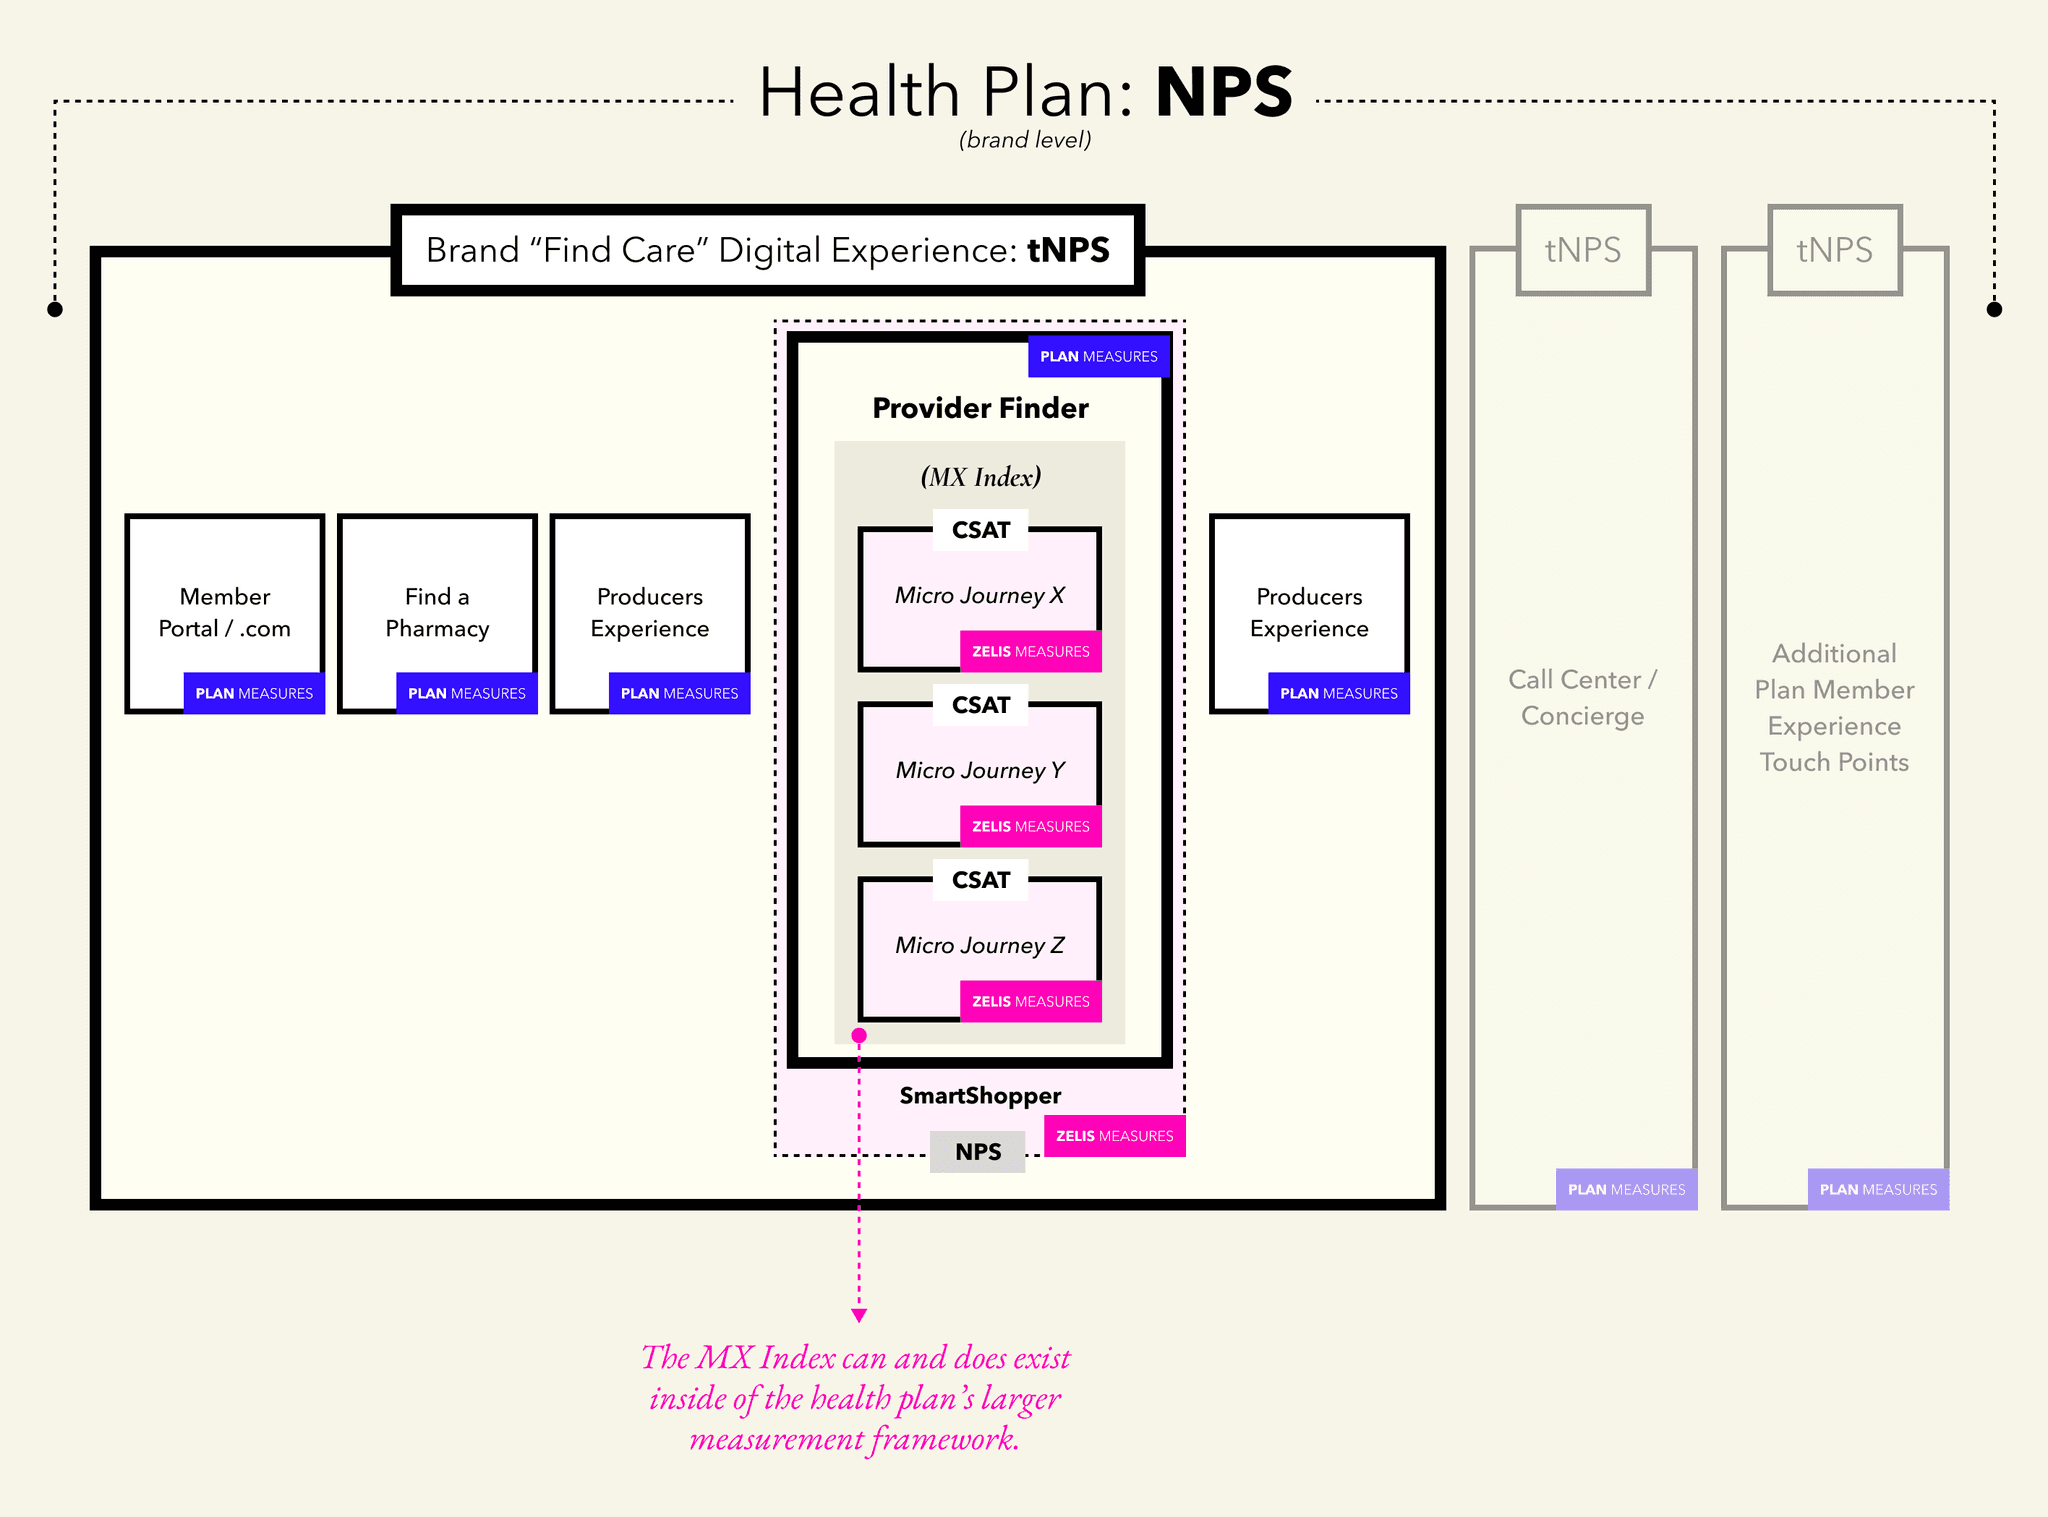
In addition to the benefit of finally being able to baseline performance, we also reinforced the concept that the MX Index didn't replace a client's MX/CX measurement methodology, rather, augmented the breadth of information they were receiving and added dimensionality they weren't able to achieve on their own. It can and does exist inside larger client frameworks and each can use the information to tell the most relevant stories for them and how the provider scores were impacting member experience all the way up to brand-level NPS.
[05]
LAUNCH & SCALING
Something is better than nothing: starting with an alpha client and manual score calculation.
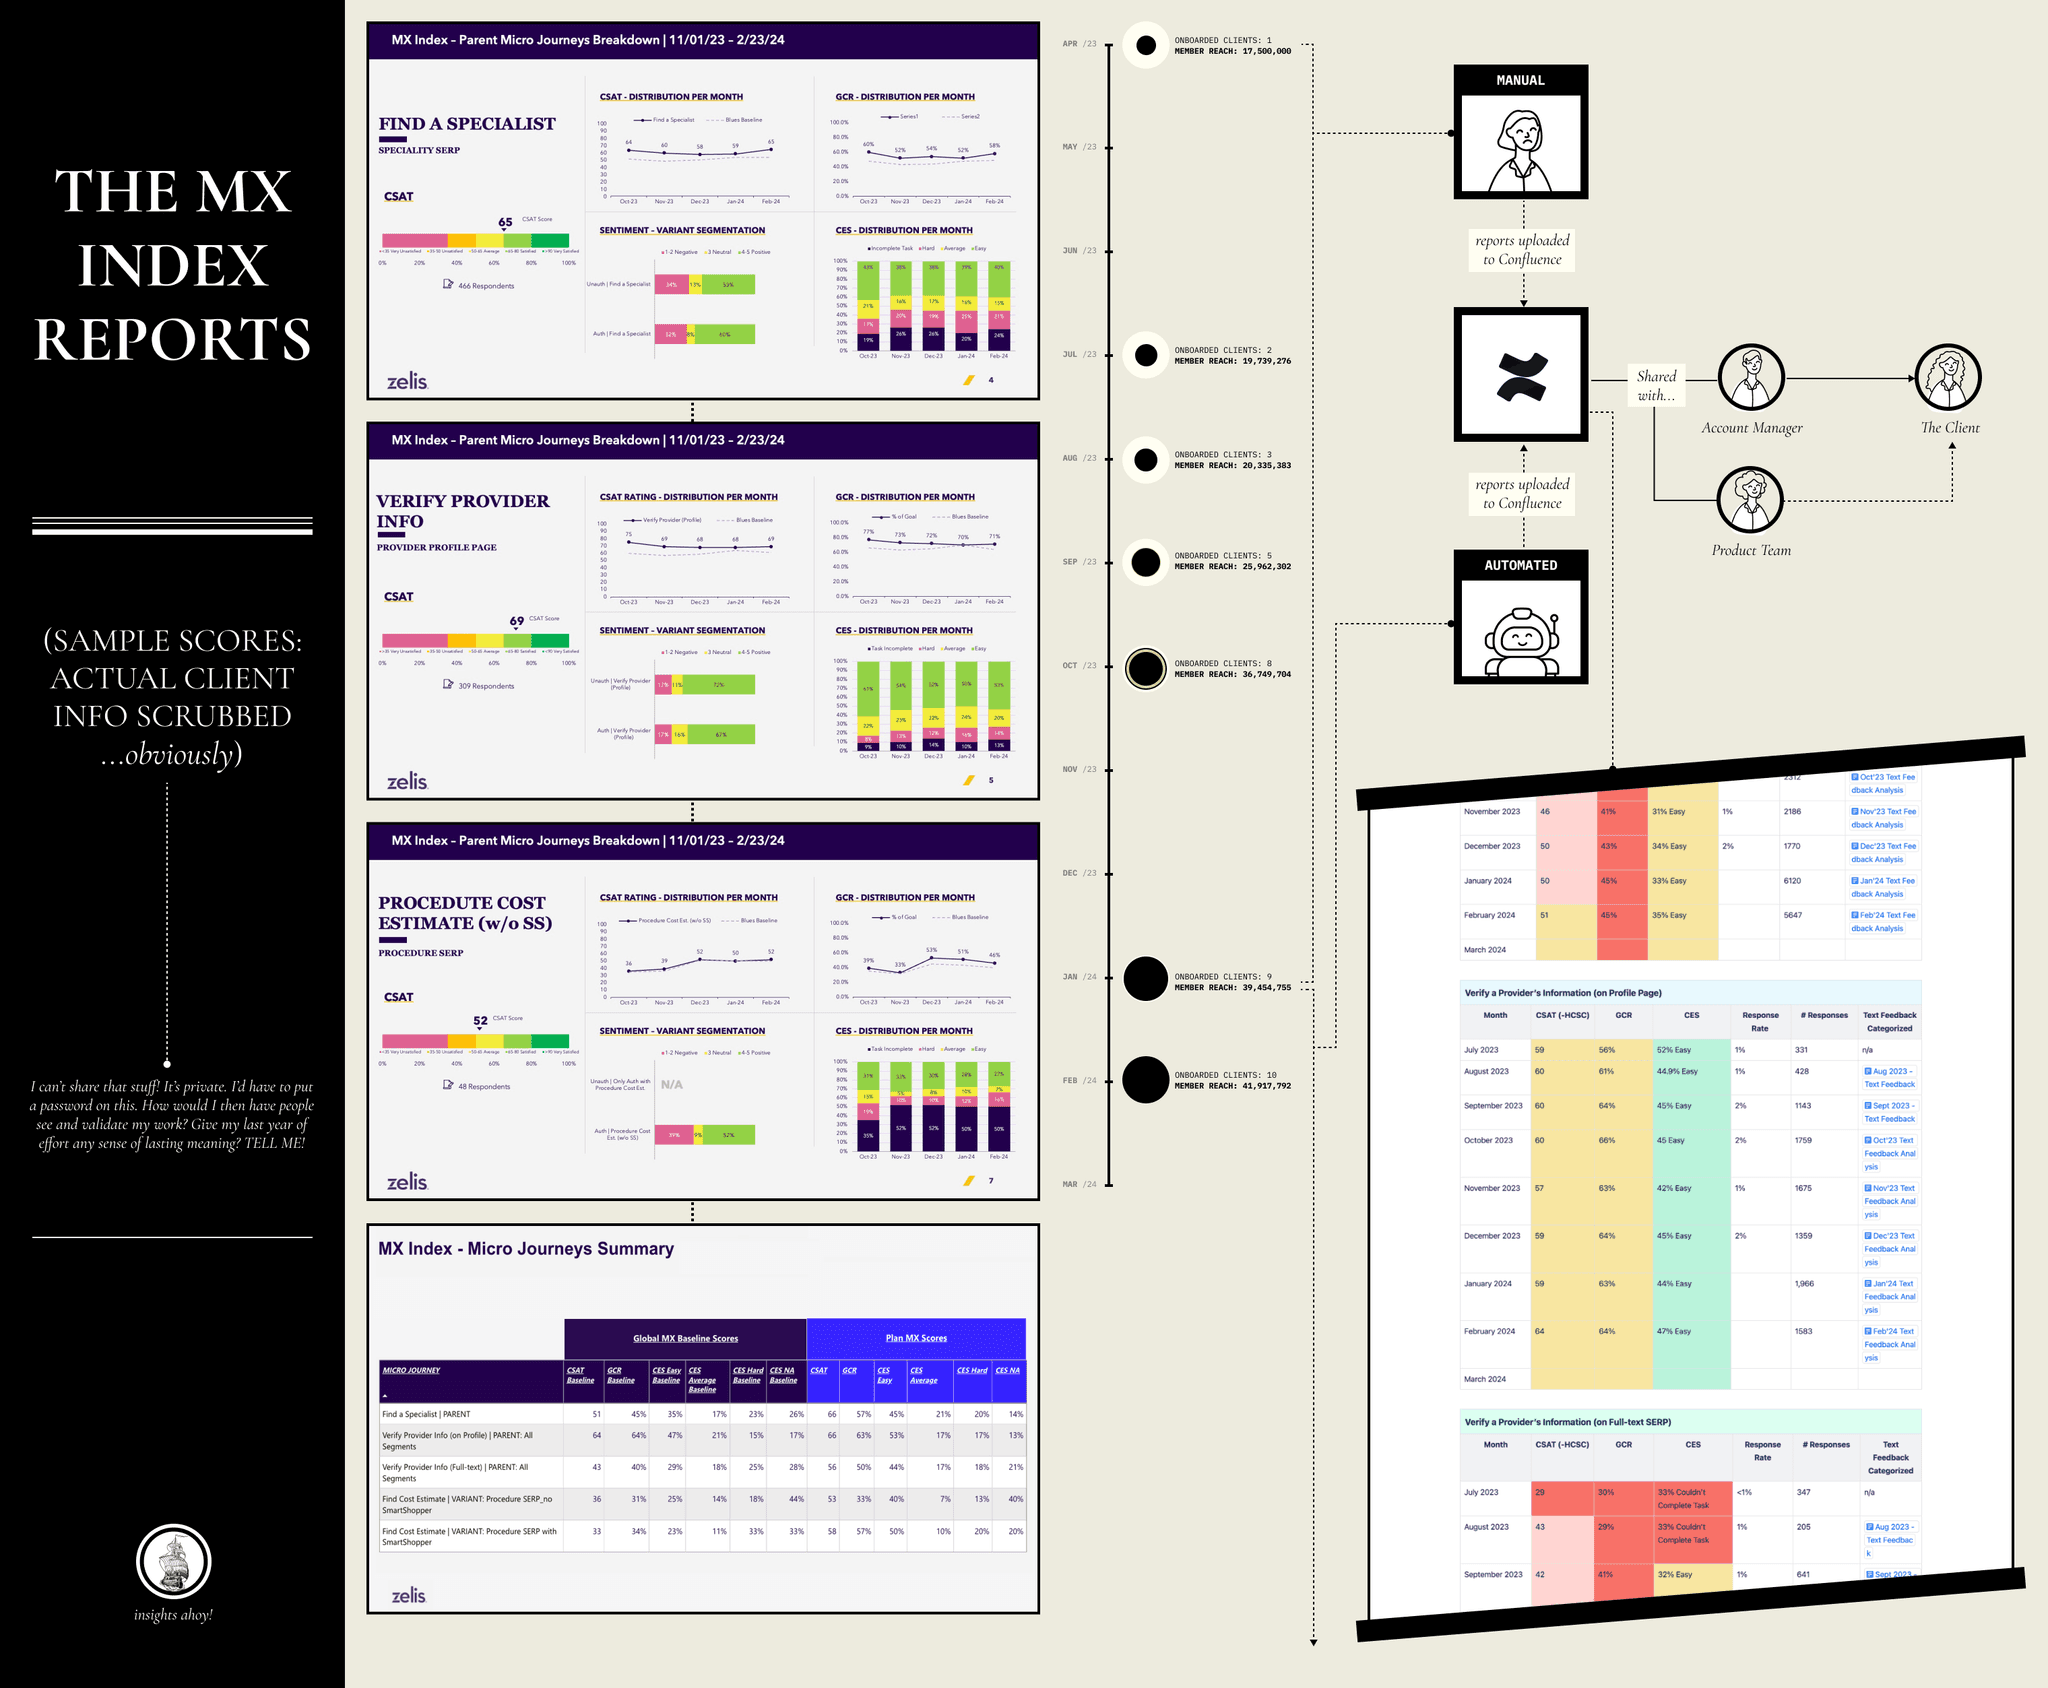
The first client to launch was also our largest. We used the survey and poll functionality in Pendo as a v1, allowing us to quickly launch outside of the constraint of our release cycles. This had the added benefit of allowing for responsive adjustments based on member feedback. There were a lot of small tweaks made over the first week, as we felt our way towards something stable.
Having the largest client on the Index was also useful for playing against the innate competitiveness across health plans. If they're on it, why aren't we?
This was also an opening for us to partner in a more collaborative way with their CX team. Sharing raw data, taking some of the pressure off having to present polished artifacts, getting on the same messaging platforms; moving a little closer to a way of working that you can feel in your gut is more productive and enjoyable. What we were calling "continuous improvement" and our client's CX team were calling "pain point remediation" were the obvious goal and intent of improved CX measurement, so it was nice to put aside nomenclature and focus on the same data sets. [fig. x]
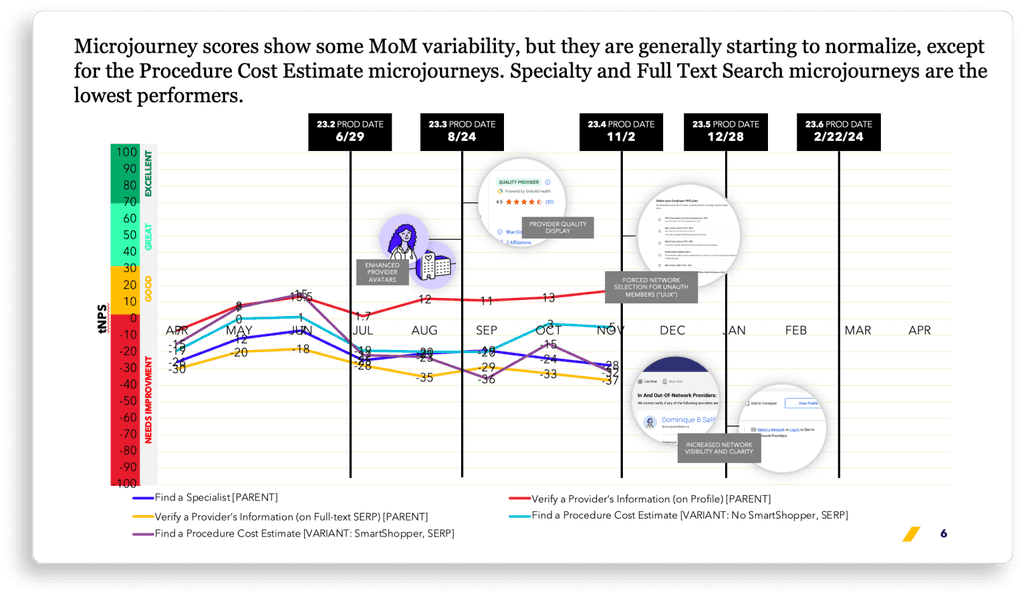
For the first ten months scoring was calculated manually. The product data analyst pulled everything from Pendo, crunched the numbers for each individual client, then worked with the communication designer to package and store each report in a client's Confluence space. Global scores were also generated by hand, put in Confluence, and injected into Product team ceremonies to make interacting with them more commonplace. [fig X].
Since this flow wasn't sustainable (we had to cap the number of clients we added to the MX Index based on the team's capacity), the BI Team helped with automating report generation. The first ten months gave us the chance to refine the report layouts, demonstrate progress to clients, and begin infusing Product's culture with analytics in an intentionally low-stakes manner.
SECTION 3
PARTS
06: Delivering Insights
07: Building Trust & Providing Transparency
[06]
DELIVERING INSIGHTS
Combining UXR and product analytics to generate the company's first CX Insights discipline.
Measurement is only useful if you’re going to do something with it. For most of our company's history, we’d spent the bulk of our BI-focused-time collecting basic product analytics, packaging them up for external consumption, and having the reports siloed off in PowerBI, a tool that our PMs and Product Designers rarely had credentials for. This way of working was so engrained, not intentionally, but rather a result of decisions over the years that were responding (in a very valid manner) to the immediate need of the business. Organizational change, even on this small scale (aka making analytics more useful and accessible internally) isn’t really achievable over night when you're working from the middle-rungs. We all read the same books, can quote the same podcasts, and know in our little hearts what a good process should/could look like, but implementing it is a different story. For us, we were lucky that we had a few things working in our favor: a blended Product and Design discipline (incase you're wondering why a Design Director stood up what a lot of people would consider a Product Ops pillar), in-house user experience research, and a product data analyst. A nascent CX Insights discipline was born and began merging UXR's qualitative insights with the quantitative insights from the MX Index.
After the first year of the MX Index, we had:
As the months ticked by and the Index’s client coverage grew, we were able to increase visibility and access to insights both internally and externally. Things started to click into place:
INTERNALLY
Myself and the VP of Product mapped Product Duos to micro-journeys and related outcomes [see The MX Index part II].
Product Duos were able to have consistent access to the CX Insights team and new tools, receiving training and support.
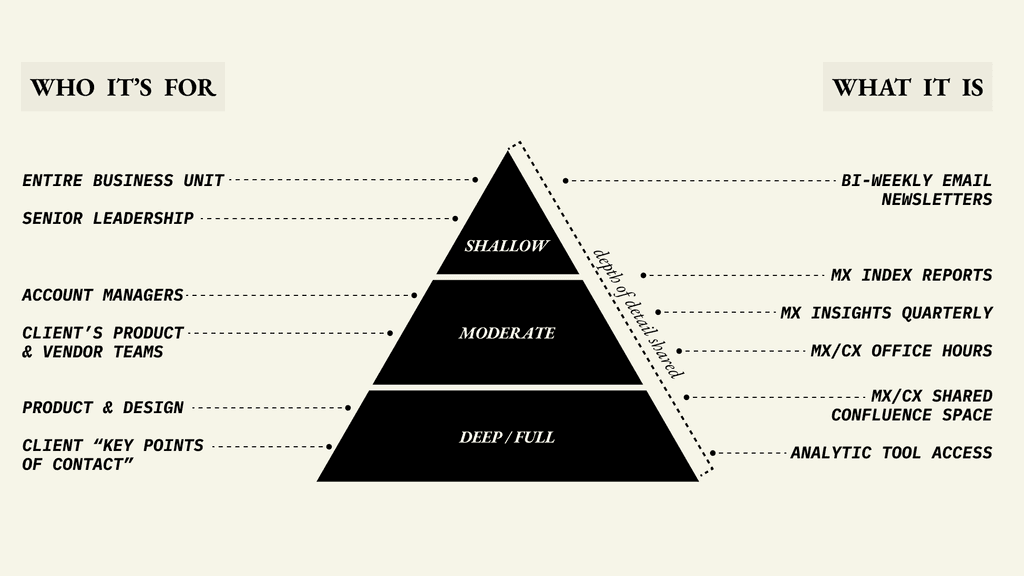
MX survey feedback, scores, and UXR output were centralized in Confluence
The CX Insights team sent bi-weekly, business-unit-wide email newsletters highlighting interesting findings (the goal was just about people being aware we have a CX Insights team and collect this sort of data).
EXTERNALLY
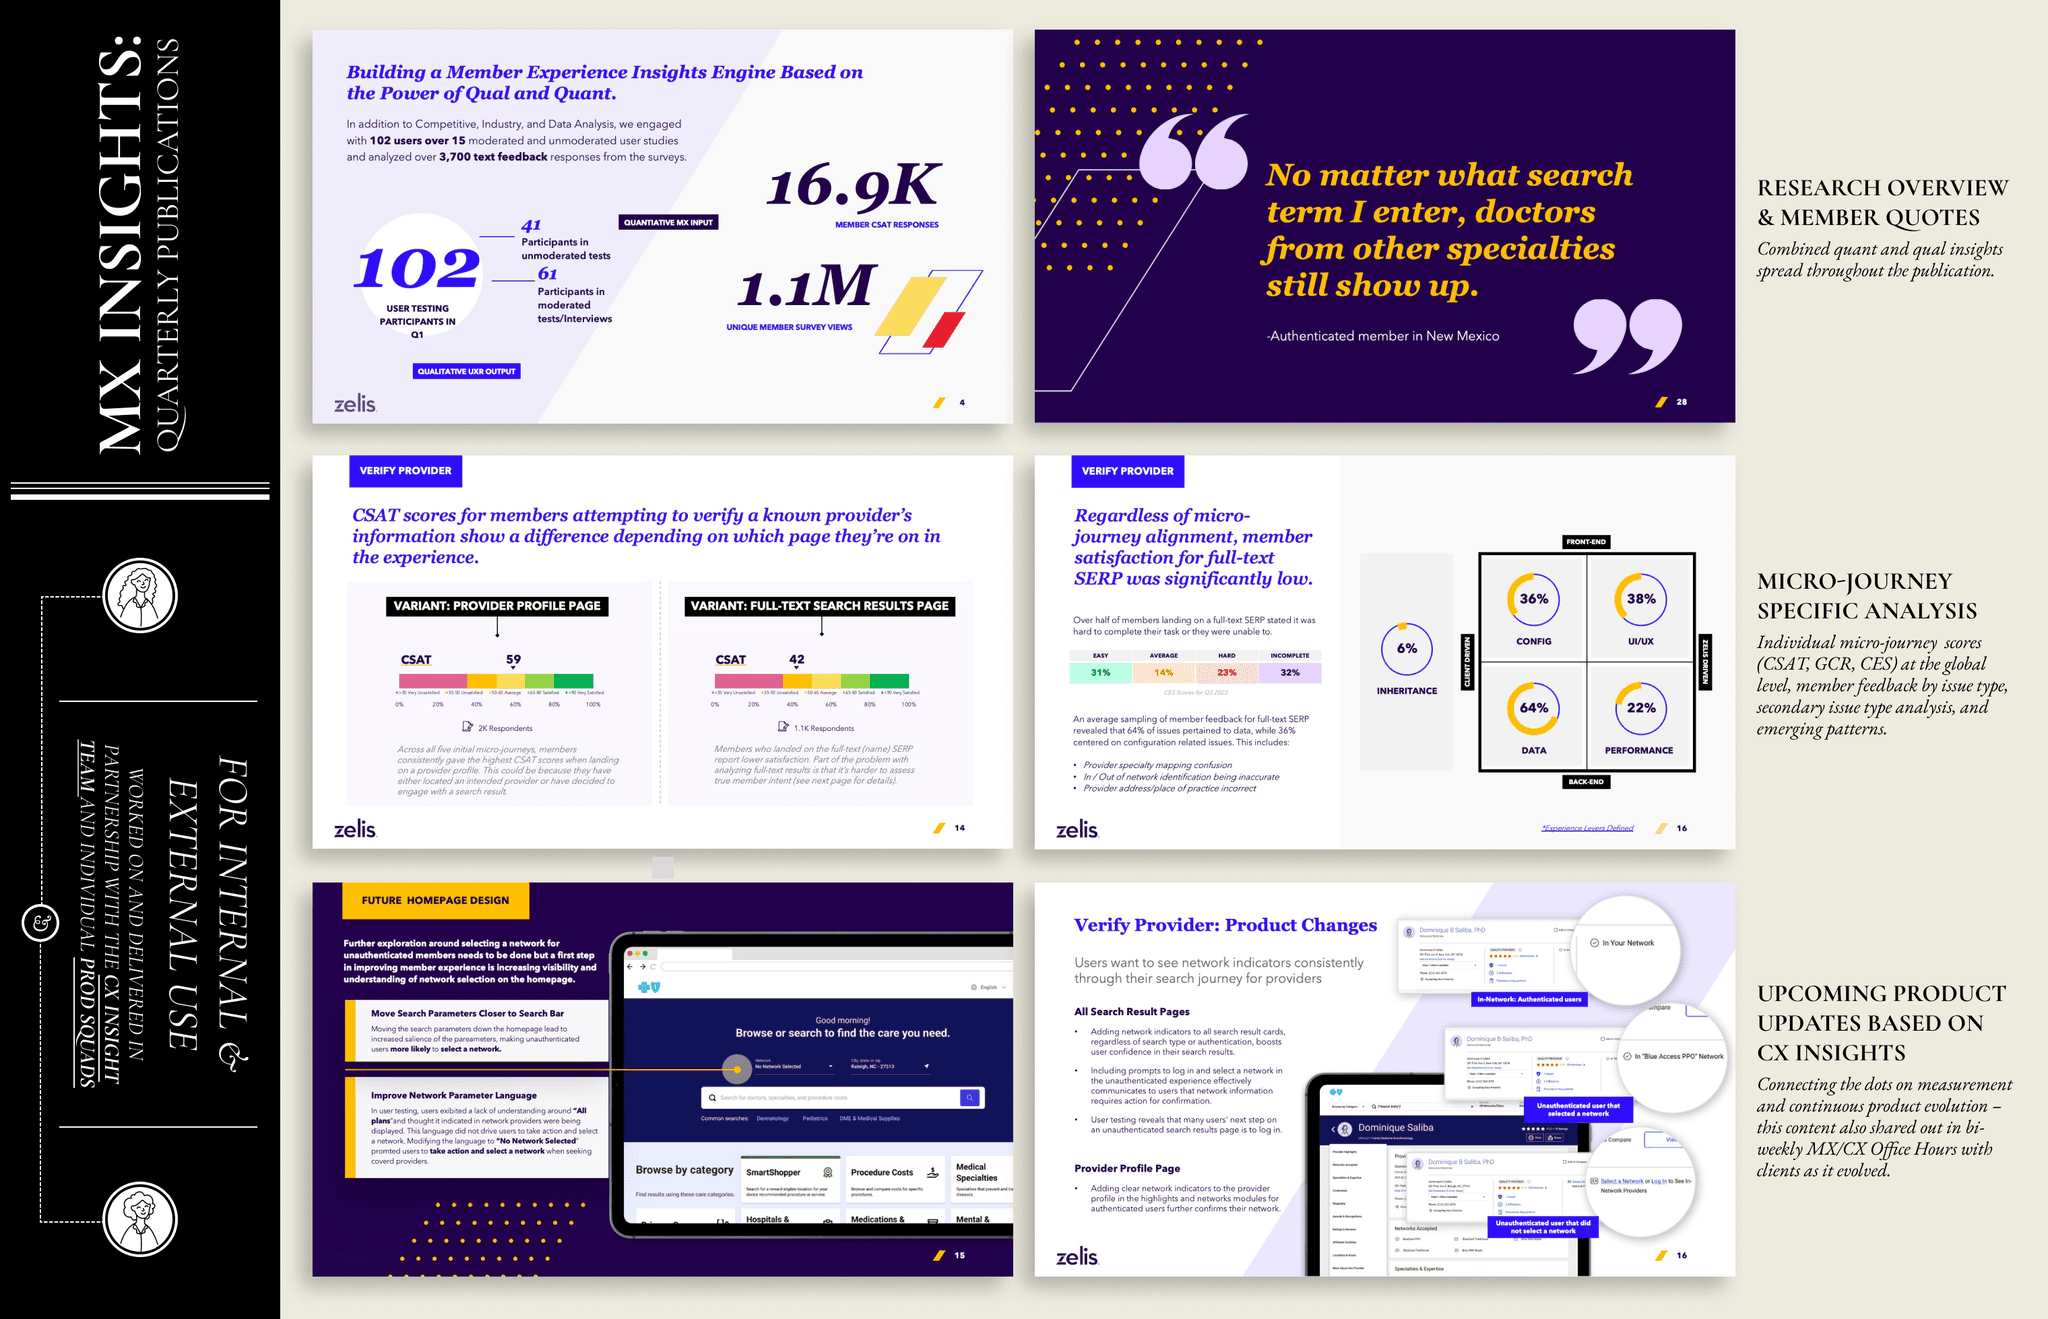
Started a “MX/CX Office Hours,” a bi-weekly meeting where we shared out in-progress product updates based on MX Index insights, intentionally in unpolished and raw formats.
Created MX Insights Quarterlies, which packaged up CX insights and related product enhancements in a more polished format, intended for broader distribution.
Plugged into client QBRs and shared MX Index scores and insights at an individual client level. This also helped with strengthening relationships with our account management team.
[fig. x] text text text
[07]
BUILDING TRUST & PROVIDING TRANSPARENCY
Improved MX measurement helped Product & Design strengthen internal and external partnerships.
One of the things that we heard loud and clear from our clients, was that we had to do a better job at connecting core UI/UX updates with a runway for them to make the config and data updates on their side to best take advantage of the work. All the ceremonies and artifacts that bloomed around the MX Index helped with reseting that conversation and provided more clarity around which continuous improvement updates to prioritize, as well as which data improvements a client would have to make. More informal conversations, more frequently, was what was needed on both sides.
We also found ourselves with the right tools to become the SMEs we always wanted to be. Product Duos formulated perspectives on their given micro-journey; why certain moments were causing dissatisfaction or members weren't able to achieve a specific goal.
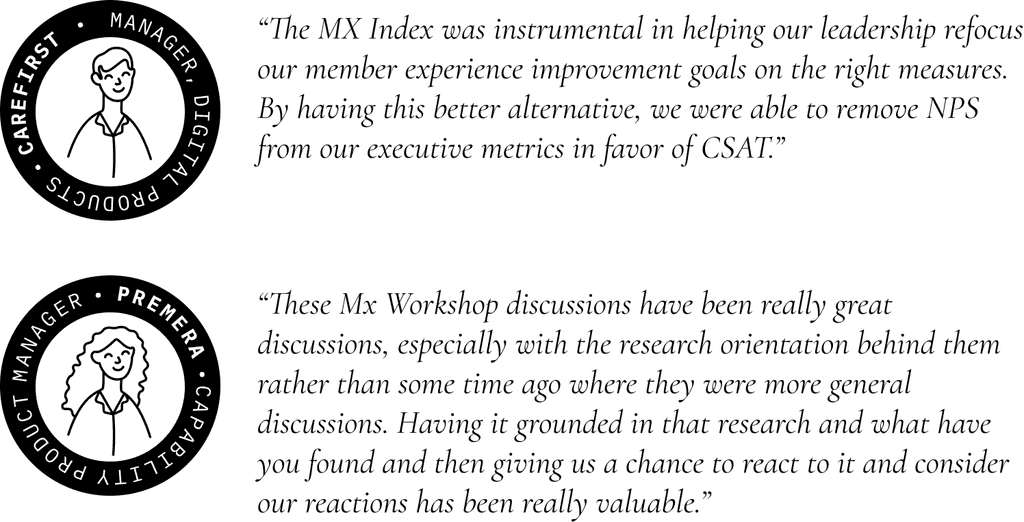
In MX/CX Office Hours, on QBR calls, in advisory presentations, the output of the MX Index began spreading out across the organization. Account managers were happier and felt armed with insights that allowed them to show up more confidently and clients themselves confirmed a shift:
ONE YEAR OF THE MX INDEX
OUTCOMES
Demonstrated thought leadership and analysis for trends in our product.
Surfaced already available configurable features that clients may have missed in set up or day -to-day tool management.
Drove alignment between Zelis and client roadmaps for continuous improvement updates—bringing greater clarity to the specific category for improvement—inheritance, data, configuration, UI, performance.
Enabled Sales, Account Management, and ICS to drive client conversations about activating available features and capabilities correlated to their member satisfaction issues.
Validated UI concepts and drove client adoption for recommend experience improvements.
Surfaced UX research in the context of recommended improvements.
Recommended measurable roadmap candidates for the annual roadmap process
KEY MEASURES OF SUCCESS
10 Health Plans onboarded enabling access to a potential 70M members
1.23M Unique member survey views
18,900 respondents across all live MX clients
660 user research participants (moderated & unmoderated) provided input on prioritized MX Index scopes
9,700 text responses with qualitative feedback
Established average baseline CSAT for finding care at 50
Shipped 8 prioritized data-driven continuous improvement scopes based on the results and client validation


