The Slow March Towards A Product Operating Model
|
[SUMMARY]
Operational changes implemented that helped the company re-think which problems to approach and how to solve them.
|
[ROLE]
Director of Design
Insights & Empowerment, BU
|
[COMPANY]

WORK IMPLEMENTED THAT MOVED THE TEAM CLOSER TO A PRODUCT OPERATING MODEL
IMPLEMENTED NEW PRODUCT FRAMEWORKS TO UNIFY AND STANDARDIZE INSIGHT CAPTURE
LED, LAUNCHED, AND INCORPORATED ADVANCED PRODUCT ANALYTICS INTO CONTINUOUS IMPROVEMENT CYCLES
CREATED FIRST BUSINESS UNIT APPROACH TO UNFIED MEASUREMENT ACROSS PRODUCT PORTFOLIO
SECTION 1
The Lay of the Land
// PARTS //
01: Fragmented CX Insights
02: Building a New Model
[01]
BUILDING IN B2B2B2C LAND
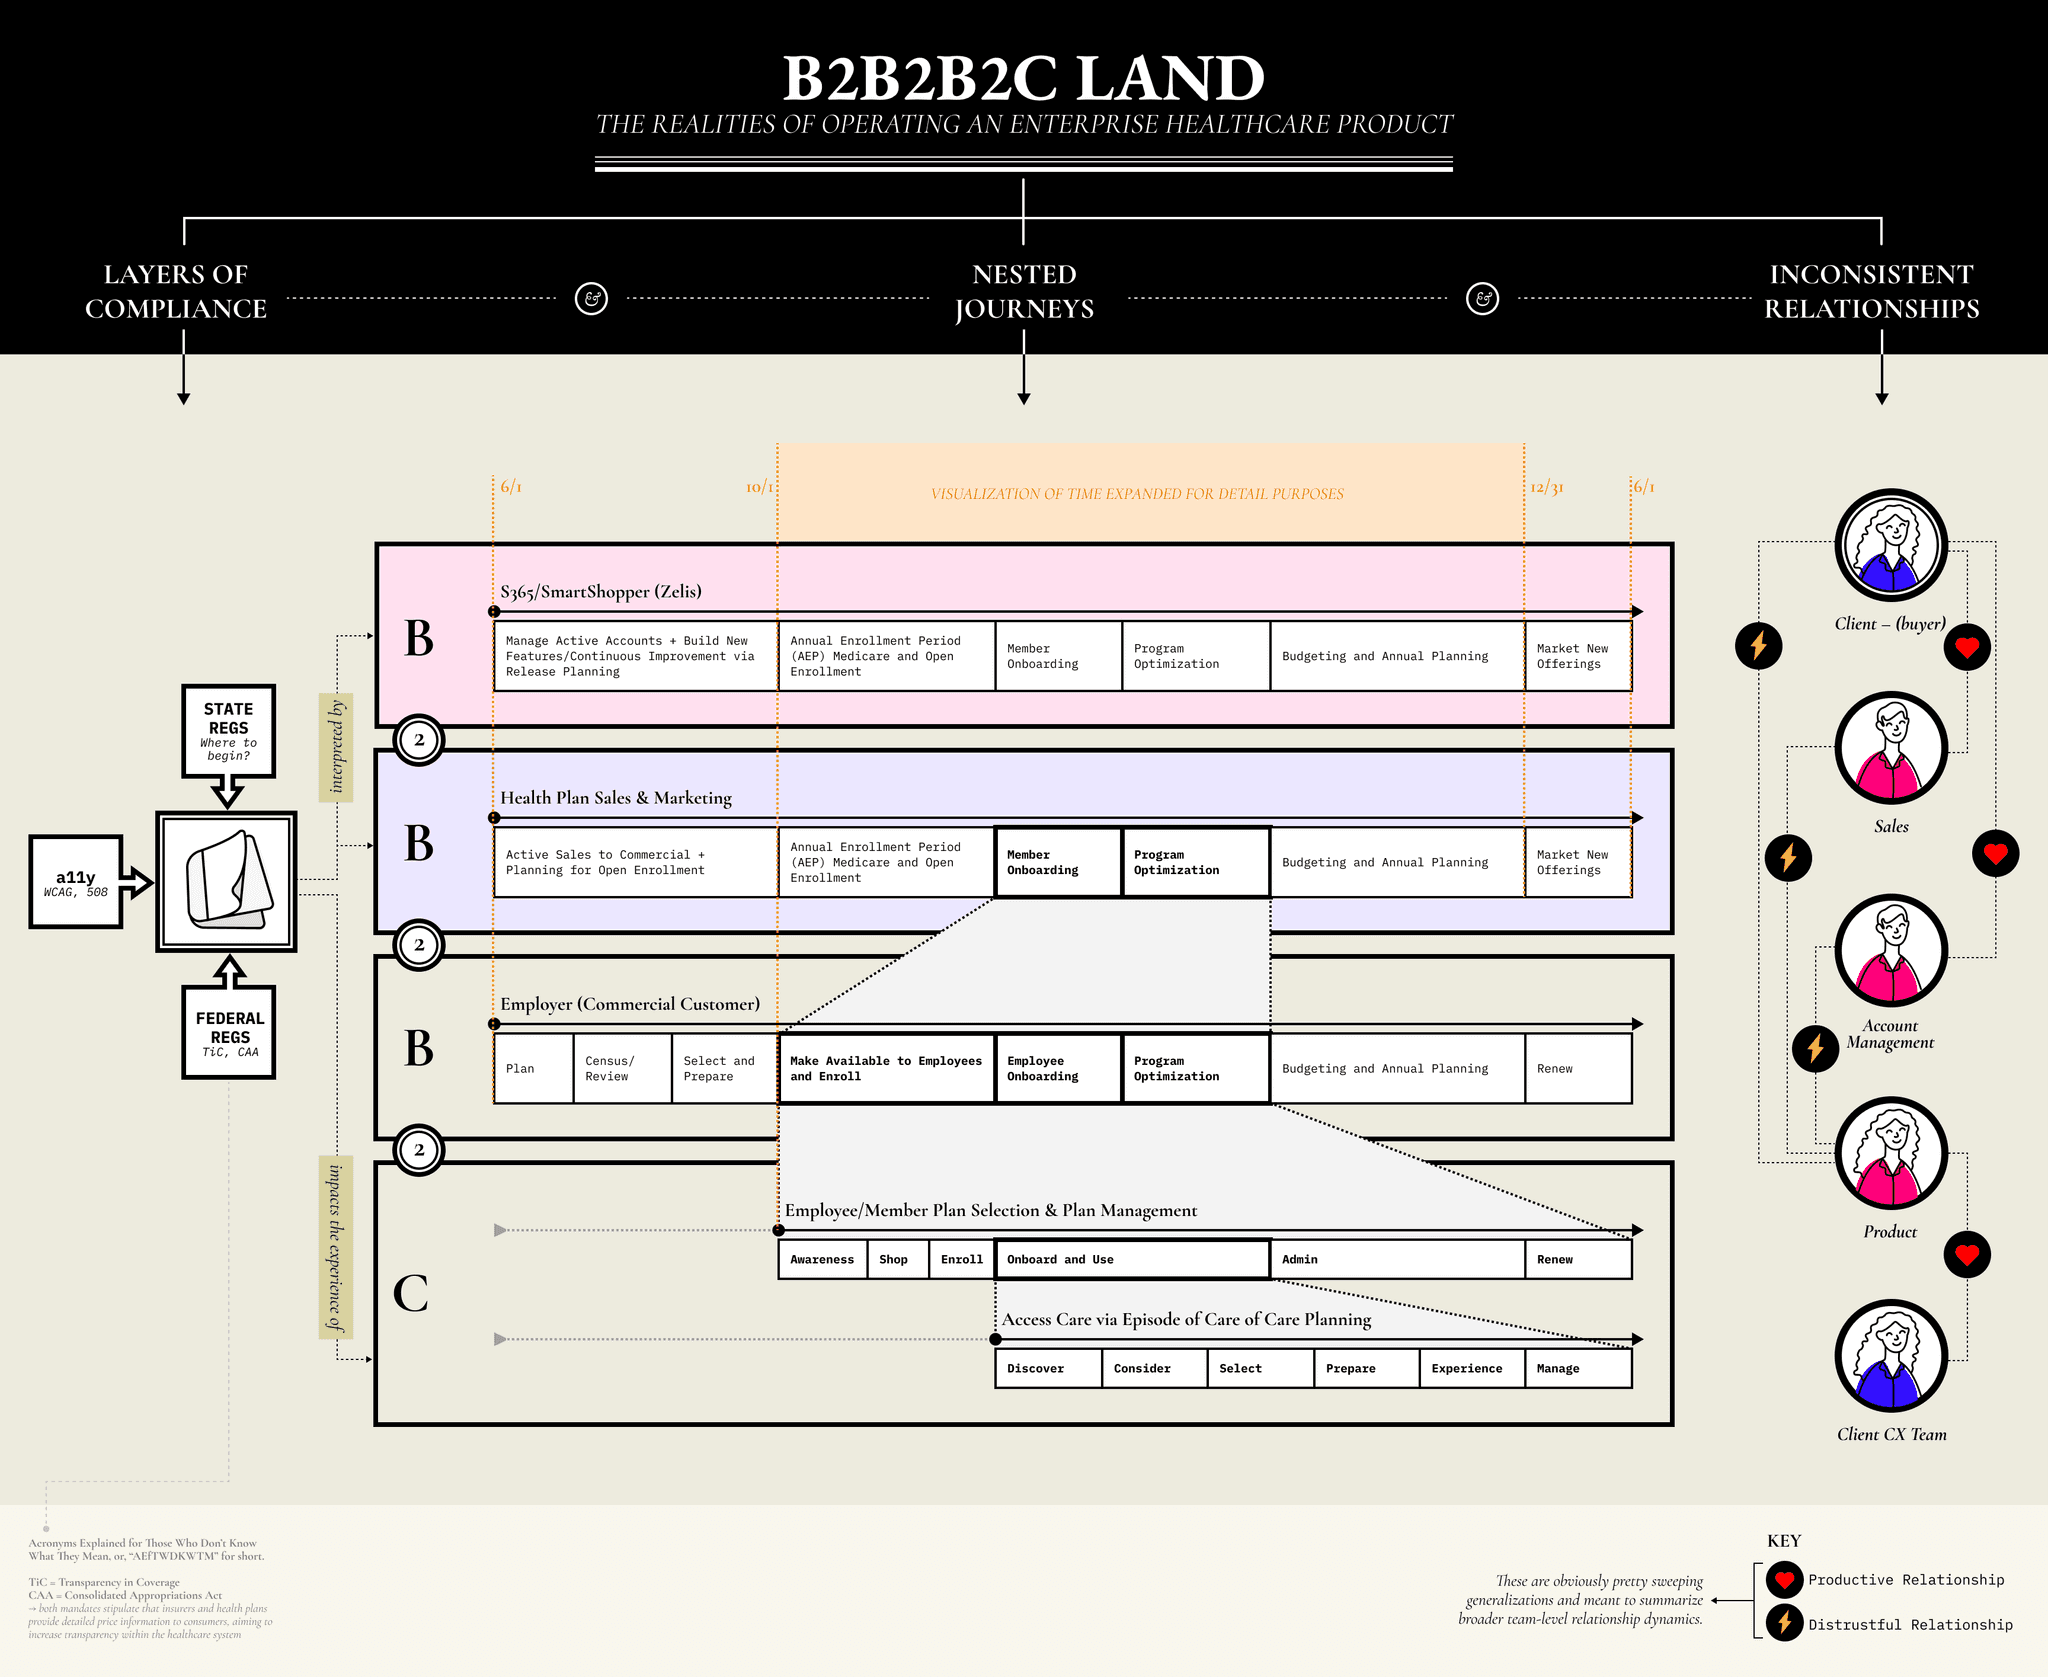
We found ourselves amidst layers of government compliance, nested in sweeping journeys across products and touchpoint out of our control, all the while struggling through internal relationships built on years of distrust.
As discussed in the previous case study (click here – if you haven’t read it yet [you’re really missing out, if I do say so myself!]), the core product I worked on at Zelis was the provider finder tool that sits inside of a health-plan’s online portal. When a member wants to find an in-network provider, or see how much a given procedure might cost, they’re using our application. We, Zelis, owned responsibility for the core experience, but clients supplied the data and drove configuration decisions around their specific implementation.
B2B2B2C is innately complex. We (the first “B”) sold our product to health plans (the second “B”), who in turn had their own set of clients like employer groups (the third “B”), who’s employees (the “C”) were the ones that used the actual tool*. Like many enterprise companies, we built a successful business on a sales-led approach to product development. So successful, we even got acquired! However, after several years of this approach, the cracks in the product foundation were getting too hard to ignore: non-evolving core UI/UX that we could see highlighted in member complaints and mid-size client threats of churn, consistently poor provider data accuracy, and difficulty in mapping client data roadmaps and configuration updates to CX improvements.
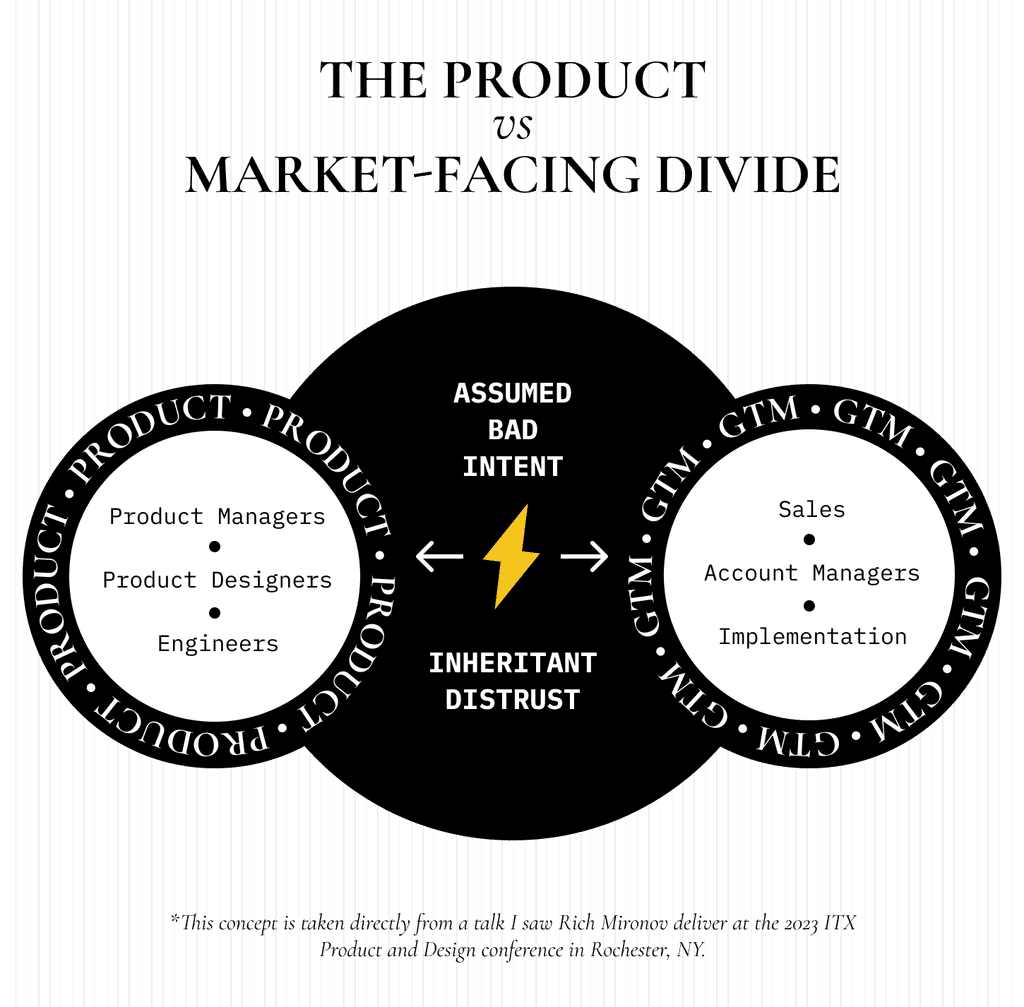
Compounding all this was an overwhelming senes of distrust and assumed bad intent across the Product and client-facing teams. Product thought Account Management was inept and didn’t understand the basics of how the product operated – AMs found Product immovable, unresponsive, and at its worst moments, openly antagonistic towards clients. Product saw Sales treating items on the roadmap as fungible placeholders for whatever they promised a given client and Sales thought Product naive to the fact that health plans have infinitely more exposure to their members and know their local markets better than we ever can.
To top it off, members often use a provider finder as a sub-step of a larger healthcare journey they’re on, which means we were nested deep in other products and experiences. This meant that the bigger the client the more they viewed our roadmap as a shopping list to add items to for securing new business; an assumption we’d always have flexibility in delivery schedules to help support and strengthen a member’s experience on the steps *around* our product.
The above sounds bad (and large parts of it were), but the irony is that most of the tension that resulted from these situations was due to a fundamental lack of knowledge about other teams and the outcomes they were trying to achieve. An individual might know a small amount about Team B, when their project steps weld them temporarily together and the friction left behind faded streaks of perceived intent, but it was easy to end up assuming that your little peek was the full extent and manifestation of that individual and their team’s goals. Most people didn’t know what other teams did because they never asked (if it sounds like I’m quoting Peter Drucker, it’s because I mostly am!). I include myself in the above too. It took a lot of time to realize that one of the core responsibilities of a good Product leader (I’m including Product Design in that umbrella term) is to evangelize your team, their goals, the work, etc...over and over and over.
So, with all this:
-The legacy of a Sales-led approach to product development
-Innate distrust between market facing and Product teams
-Space for updates based on government regulation carved in stone to release capacity
How did we eventually start to move towards some semblance of a product operating model?
* This is of course a simplification, as there were additional persona types to consider like customer service agents who could perform actions on behalf of a member, a family member on the plan who might be the primary user of the product, etc.
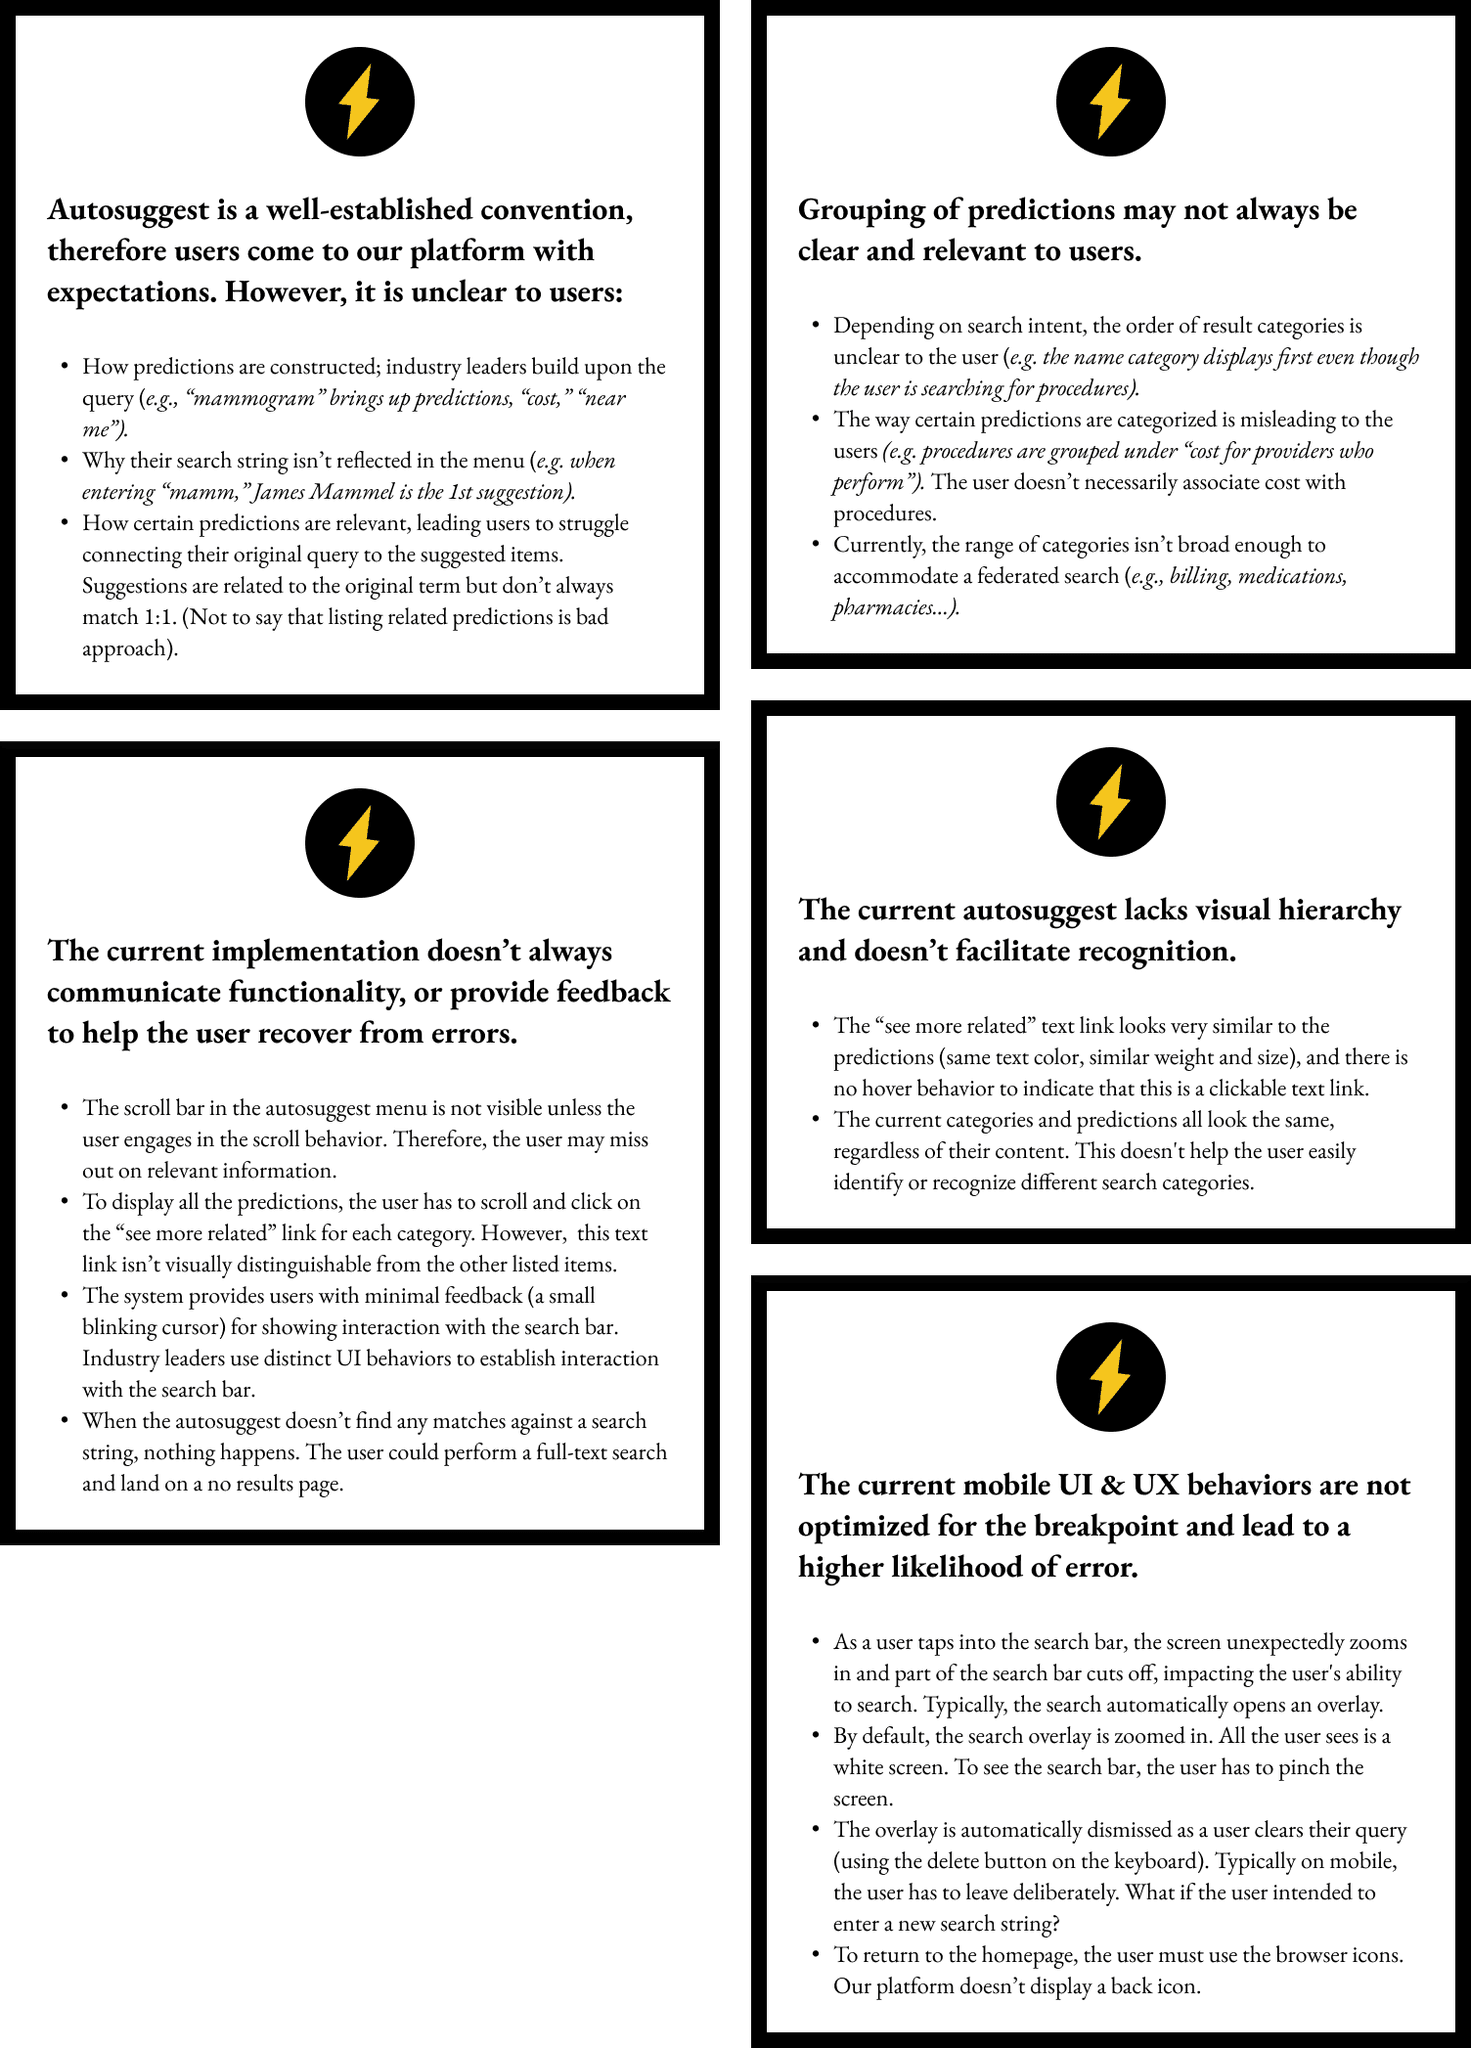
[fig. 1] High-level pain points for the autosuggest feature
[02]
SLOUCHING TOWARDS CX-LEHEM
Churning and churning in the widening gyre
The PM cannot hear the designer;
Things fall apart; the roadmap cannot hold;
Mediocrity is loosed upon the world.
Sometimes proper ways of working emerge without the broader strength there to transmute them into calcified process; roots pushing through the cracks of a cemented process. The yearlong evolution of our autosuggest feature is a mini case study in this.
Getting buy-in for the first round of improvements to our autosuggest came about because of client pressure. Several had internal initiatives around ensuring their core UX met baseline member satisfaction and when they received complaints about our search experience, that dissatisfaction in turn was funneled to our account management and leadership teams. That’s one of the kickers of being in B2B2B2C Land: the difference between knowing something is broken and getting the capacity to work on it are two separate streams of work.
We knew that search, or rather, “find,” has several dimensions, but that before improving the way results are showing up, you need to make sure people can actually get to them! We’d spent the previous year working on reducing instances of “no results,” so now the focus would be the autosuggest feature. With release capacity reserved, we assigned one of our PM and Product Designer pairs (which we termed “Product Duos”) to unpacking initial pain points, cataloging improvement types, and making the initial round of enhancements.
Through heuristic analysis, usability testing, and industry & adjacent industry audits, the duo summarized the core issues (summarized in the adjacent figure) and prioritized UI improvements since addressing data and configuration updates at this scale had never been attempted across the entire client-base.
The enhancements were spread out over two releases and included:
bolding for string matches in result set
increased visual separation of categories: avatars and icons for category types
autosuggest being refactored to pull all components from the newly updated DLS and monorepo.

SECTION 2
A New Way of Working
// PARTS //
01: Fragmented CX Insights
02: Building a New Model
[03]
MODEL ENVY
Who’s that beautiful framework I see before me? In that Amazon Basics printed book? Whispering to me on Lenny’s podcast as I walk my dog at night?
Reading about how to structure or run your Product Team isn’t hard: adapting frameworks to your organizational shape is. For us, that meant taking the commonly accepted principle of the “Product Trio” and starting with “Product Duos.” We’d had several false starts over the years trying to get the right team structure in place – to click and run. We fell apart because we went too big, trying to implement an idealized process based on read theory. A reality for us was that getting Engineering bolted into the Product Trio was too difficult. Either we (myself included) weren’t spending enough time coaching the teams on how to function, but also there was a sense that every single engineer needed to be involved in the process, which bloated several of the teams with people who didn’t care too much.
We settled on reverting for the time being to Product Duos, building on an already existing closeness of PMs and Product Designers. This was a natural fusing and several duos became joined at the hip, meeting daily without forced scheduling. They also began growing more comfortable in each other’s world: the PMs sitting in on usability testing and some making their own design variations in Figma and the Product Designers spending time to learn about configuration set ups, how data flowed in and out of the product, etc.
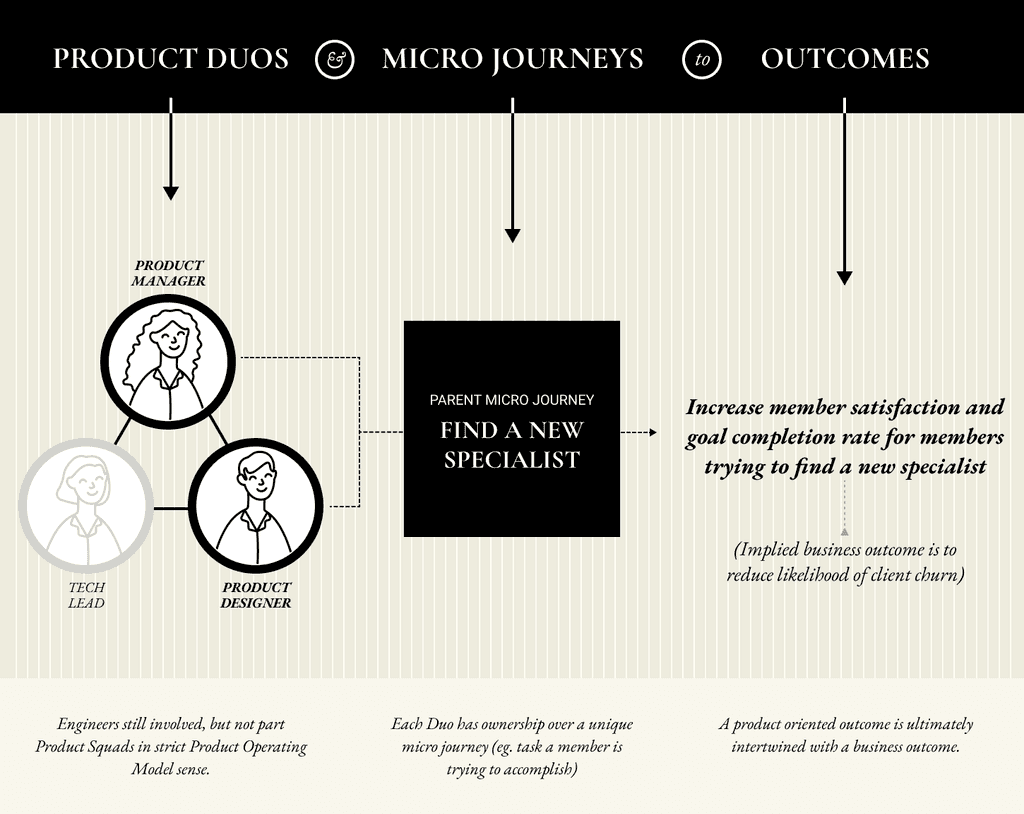
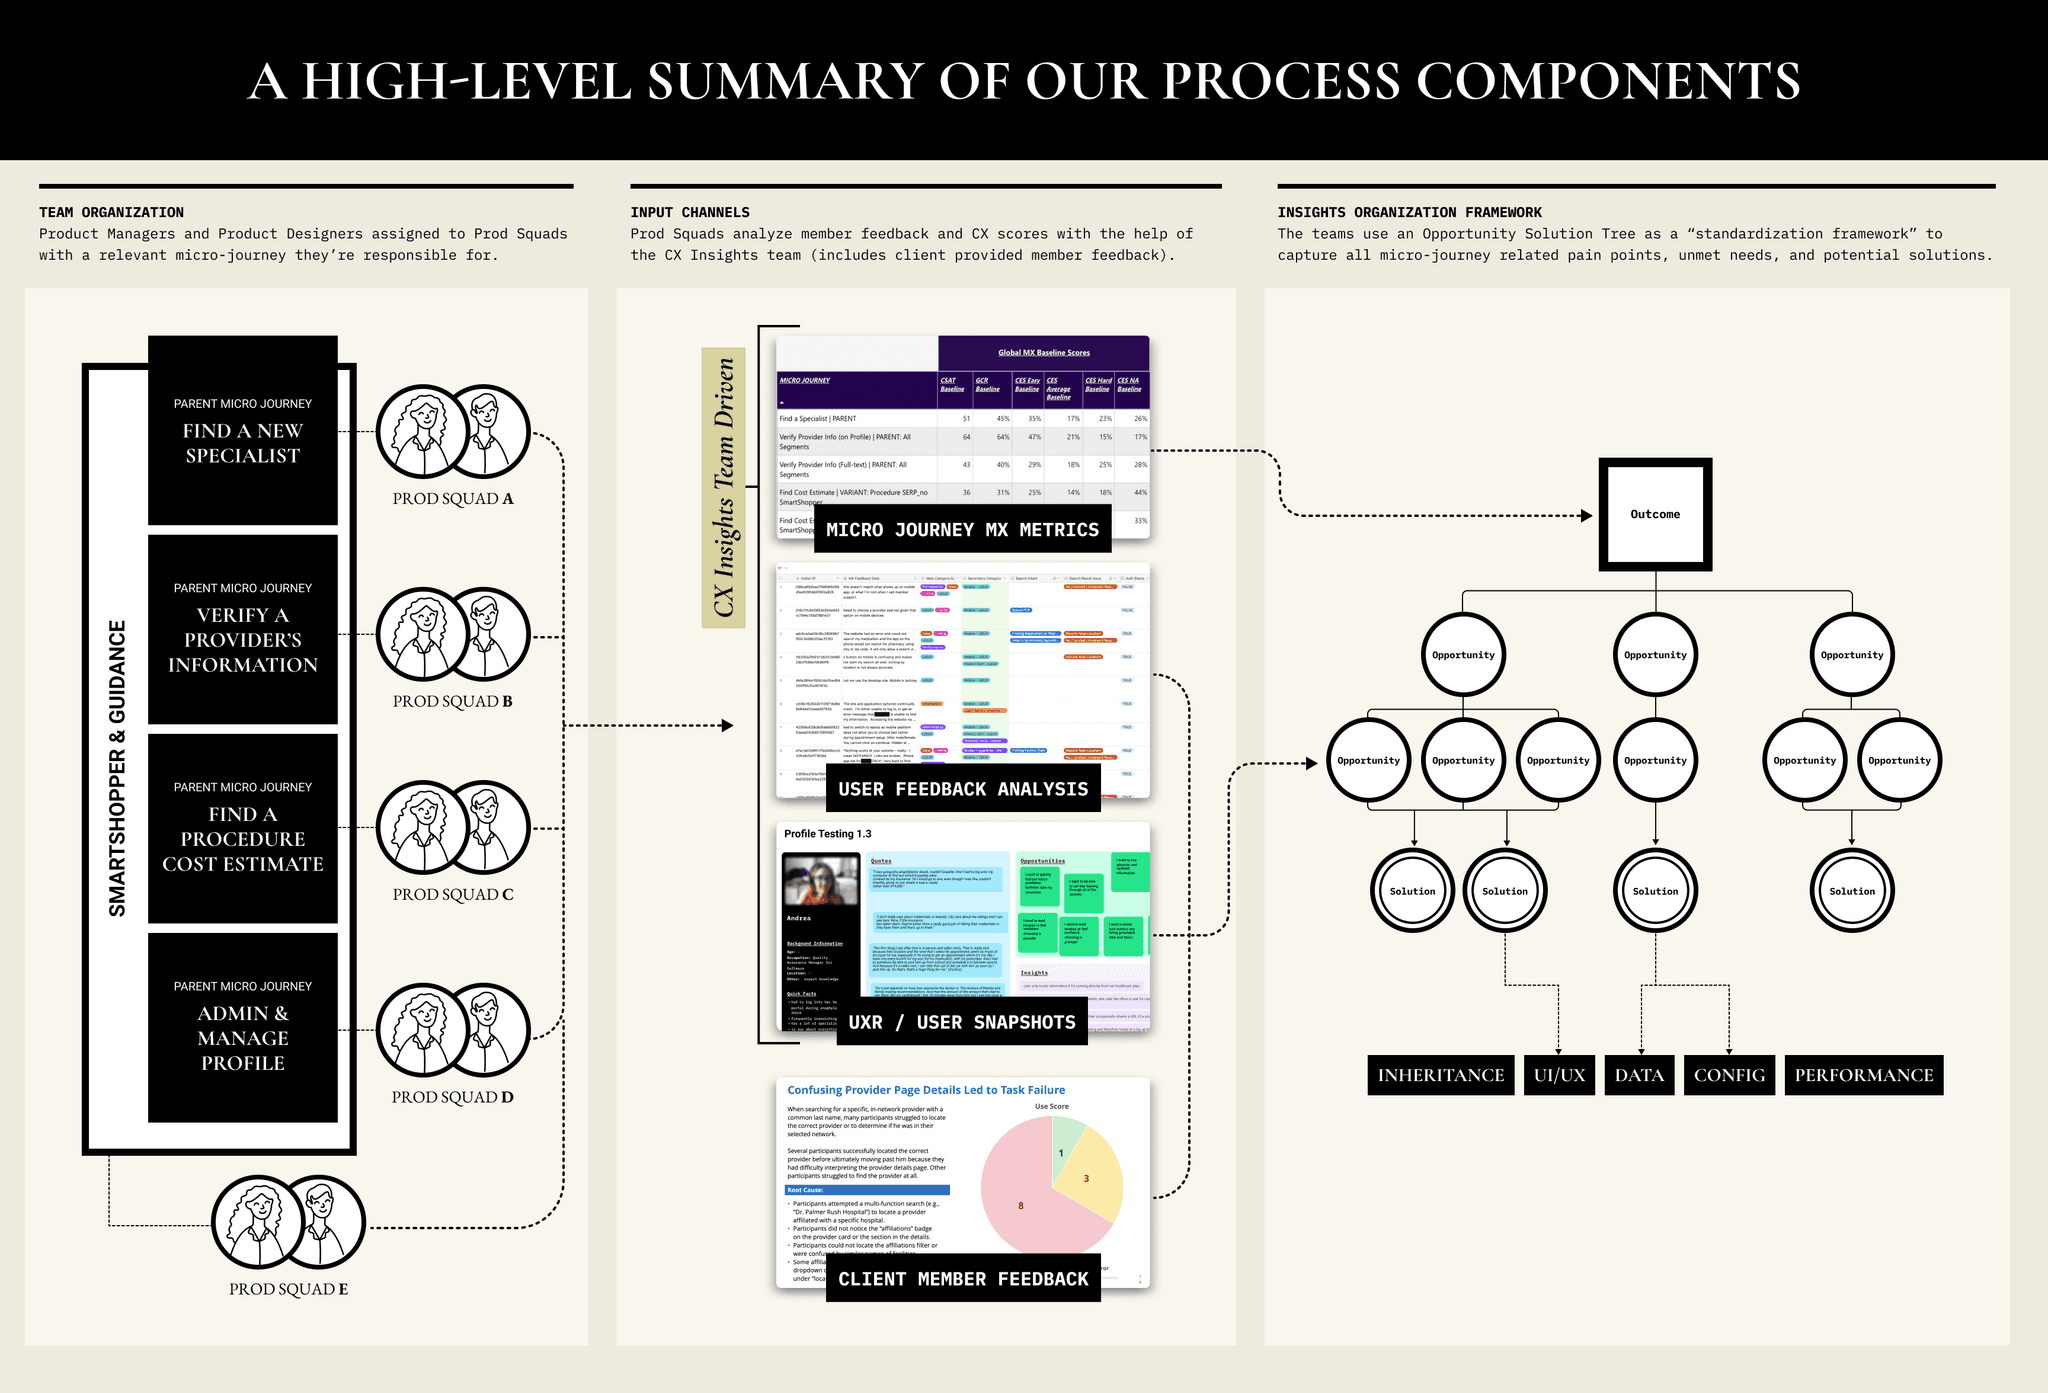
The real process breakthrough came when we attached Product Duos to micro-journeys (as referenced in the previous case study, micro journeys are simply tasks members are trying to achieve when they come to the site). This enabled the duos to be responsible for journey-level experiences across the platform and most importantly had **outcomes** they were responsible for.
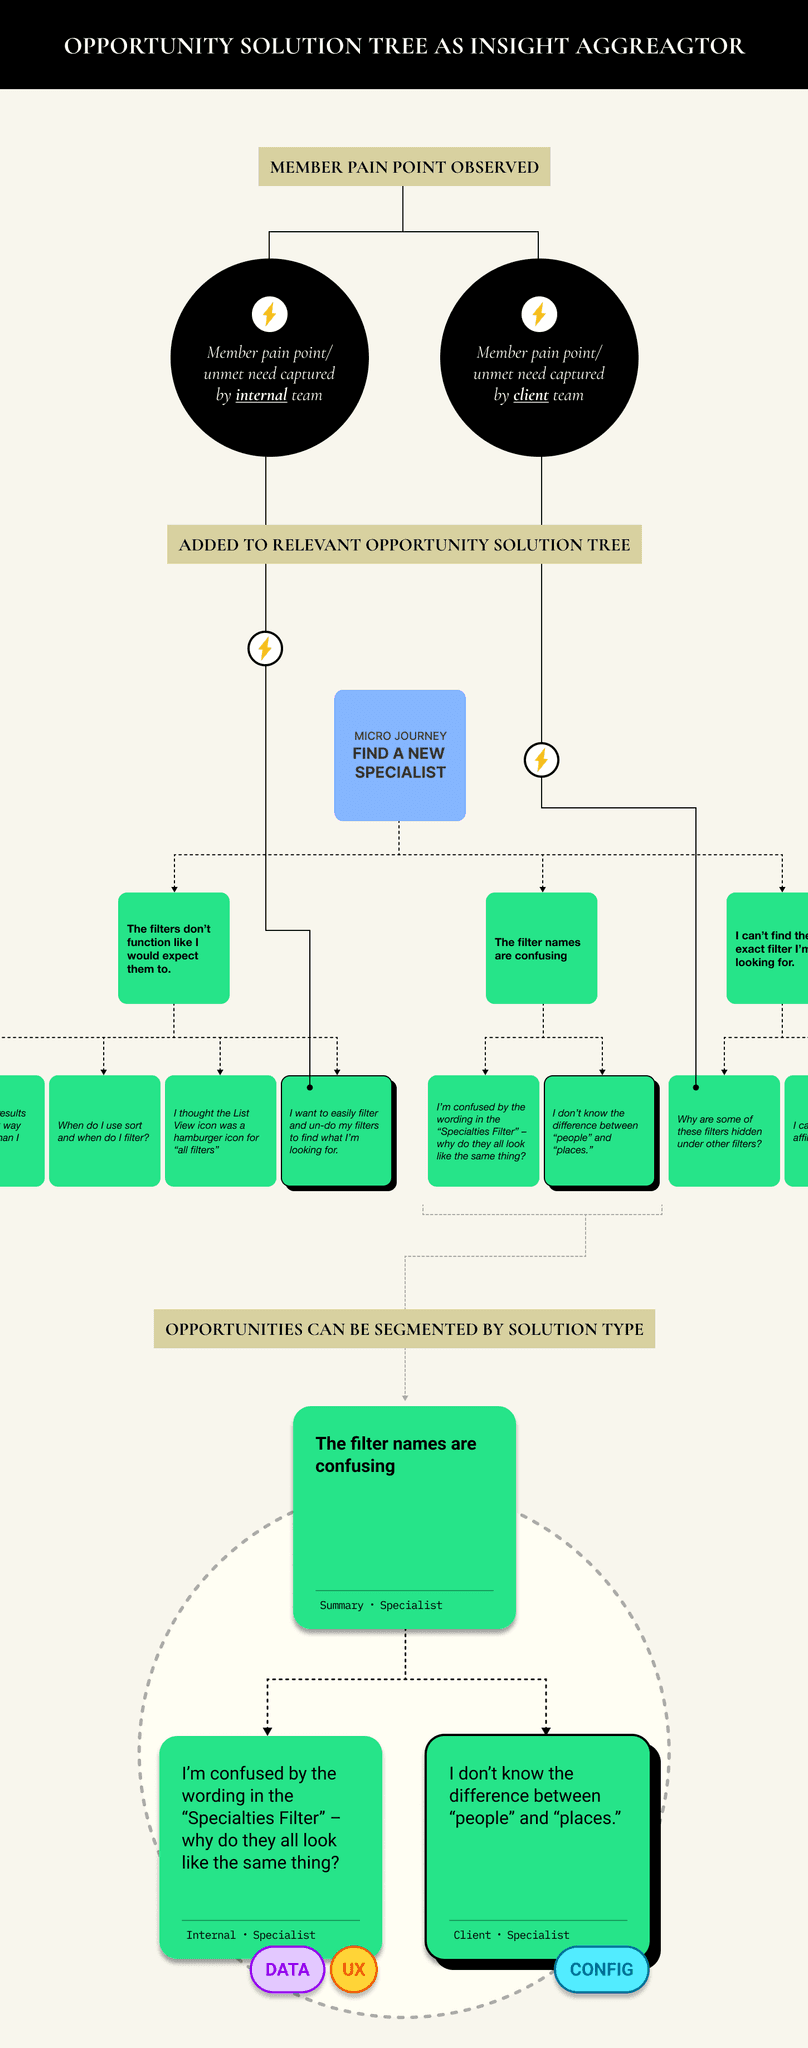
[fig. 4] Starting with a duo and connecting them to a discreet micro-journey, making them responsible for product outcomes (in addition to the client-driven roadmap work that never goes away).
Outcomes for micro journeys (eg. increase member satisfaction and goal completion rate for members trying to find a new specialist) fit naturally with the concept of Opportunity Solution Trees as calcified by Teresa Torres. As a sign of the changing times, adoption of OST was led by the Design Team. We were fortunate to have the space and time one summer to ingest, mold, and pilot them within the organization, driving them into the tool belt of the Duos. Opportunity Solution Trees were also a perfect conceptual and visual framework for something we struggled with as an enterprise software product team, which was balancing internal and external insights. The model is a fantastic lens, or organizational structure for collecting member feedback from **any** source (CX Insight team and our clients) and putting it in a single location. The duos were able to have a standardization approach to insights and easily show how their solutions at a core product level were prioritized.
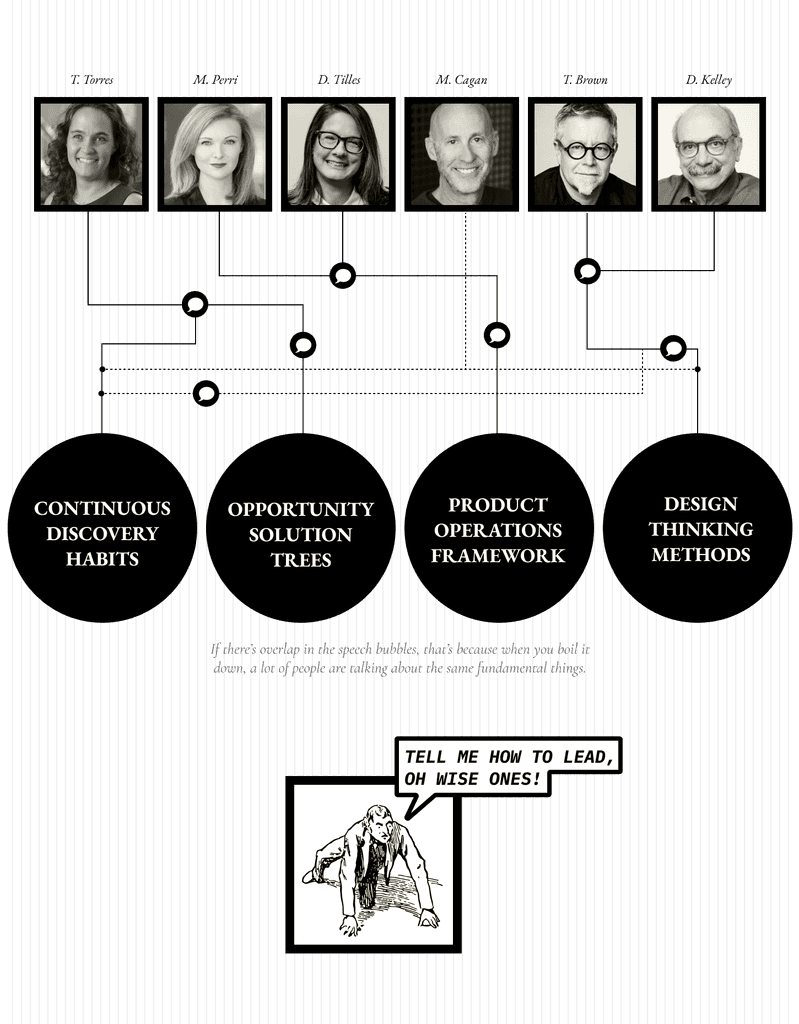
A final note: Marty Cagan talks about the importance of product leaders simplifying complex information in his latest book, *Transformed.* I think this is a non-controversial statement, but it’s something that can be overlooked or not followed through on for a lot of leaders. One of my goals with he shift towards some semblance of a product-operating model was to try help the team make sense of this framework of frameworks: opportunity solution trees, continuous discovery habits, design thinking, product operations, design operations, unified metrics frameworks, and on and on and on. It was continual; reading, discussing, welding and modifying pieces together until we got to some kind of shell that allowed the duos to operate somewhat independently on driving their micro journey’s outcomes.
[04]
APPLIED PRACTICE
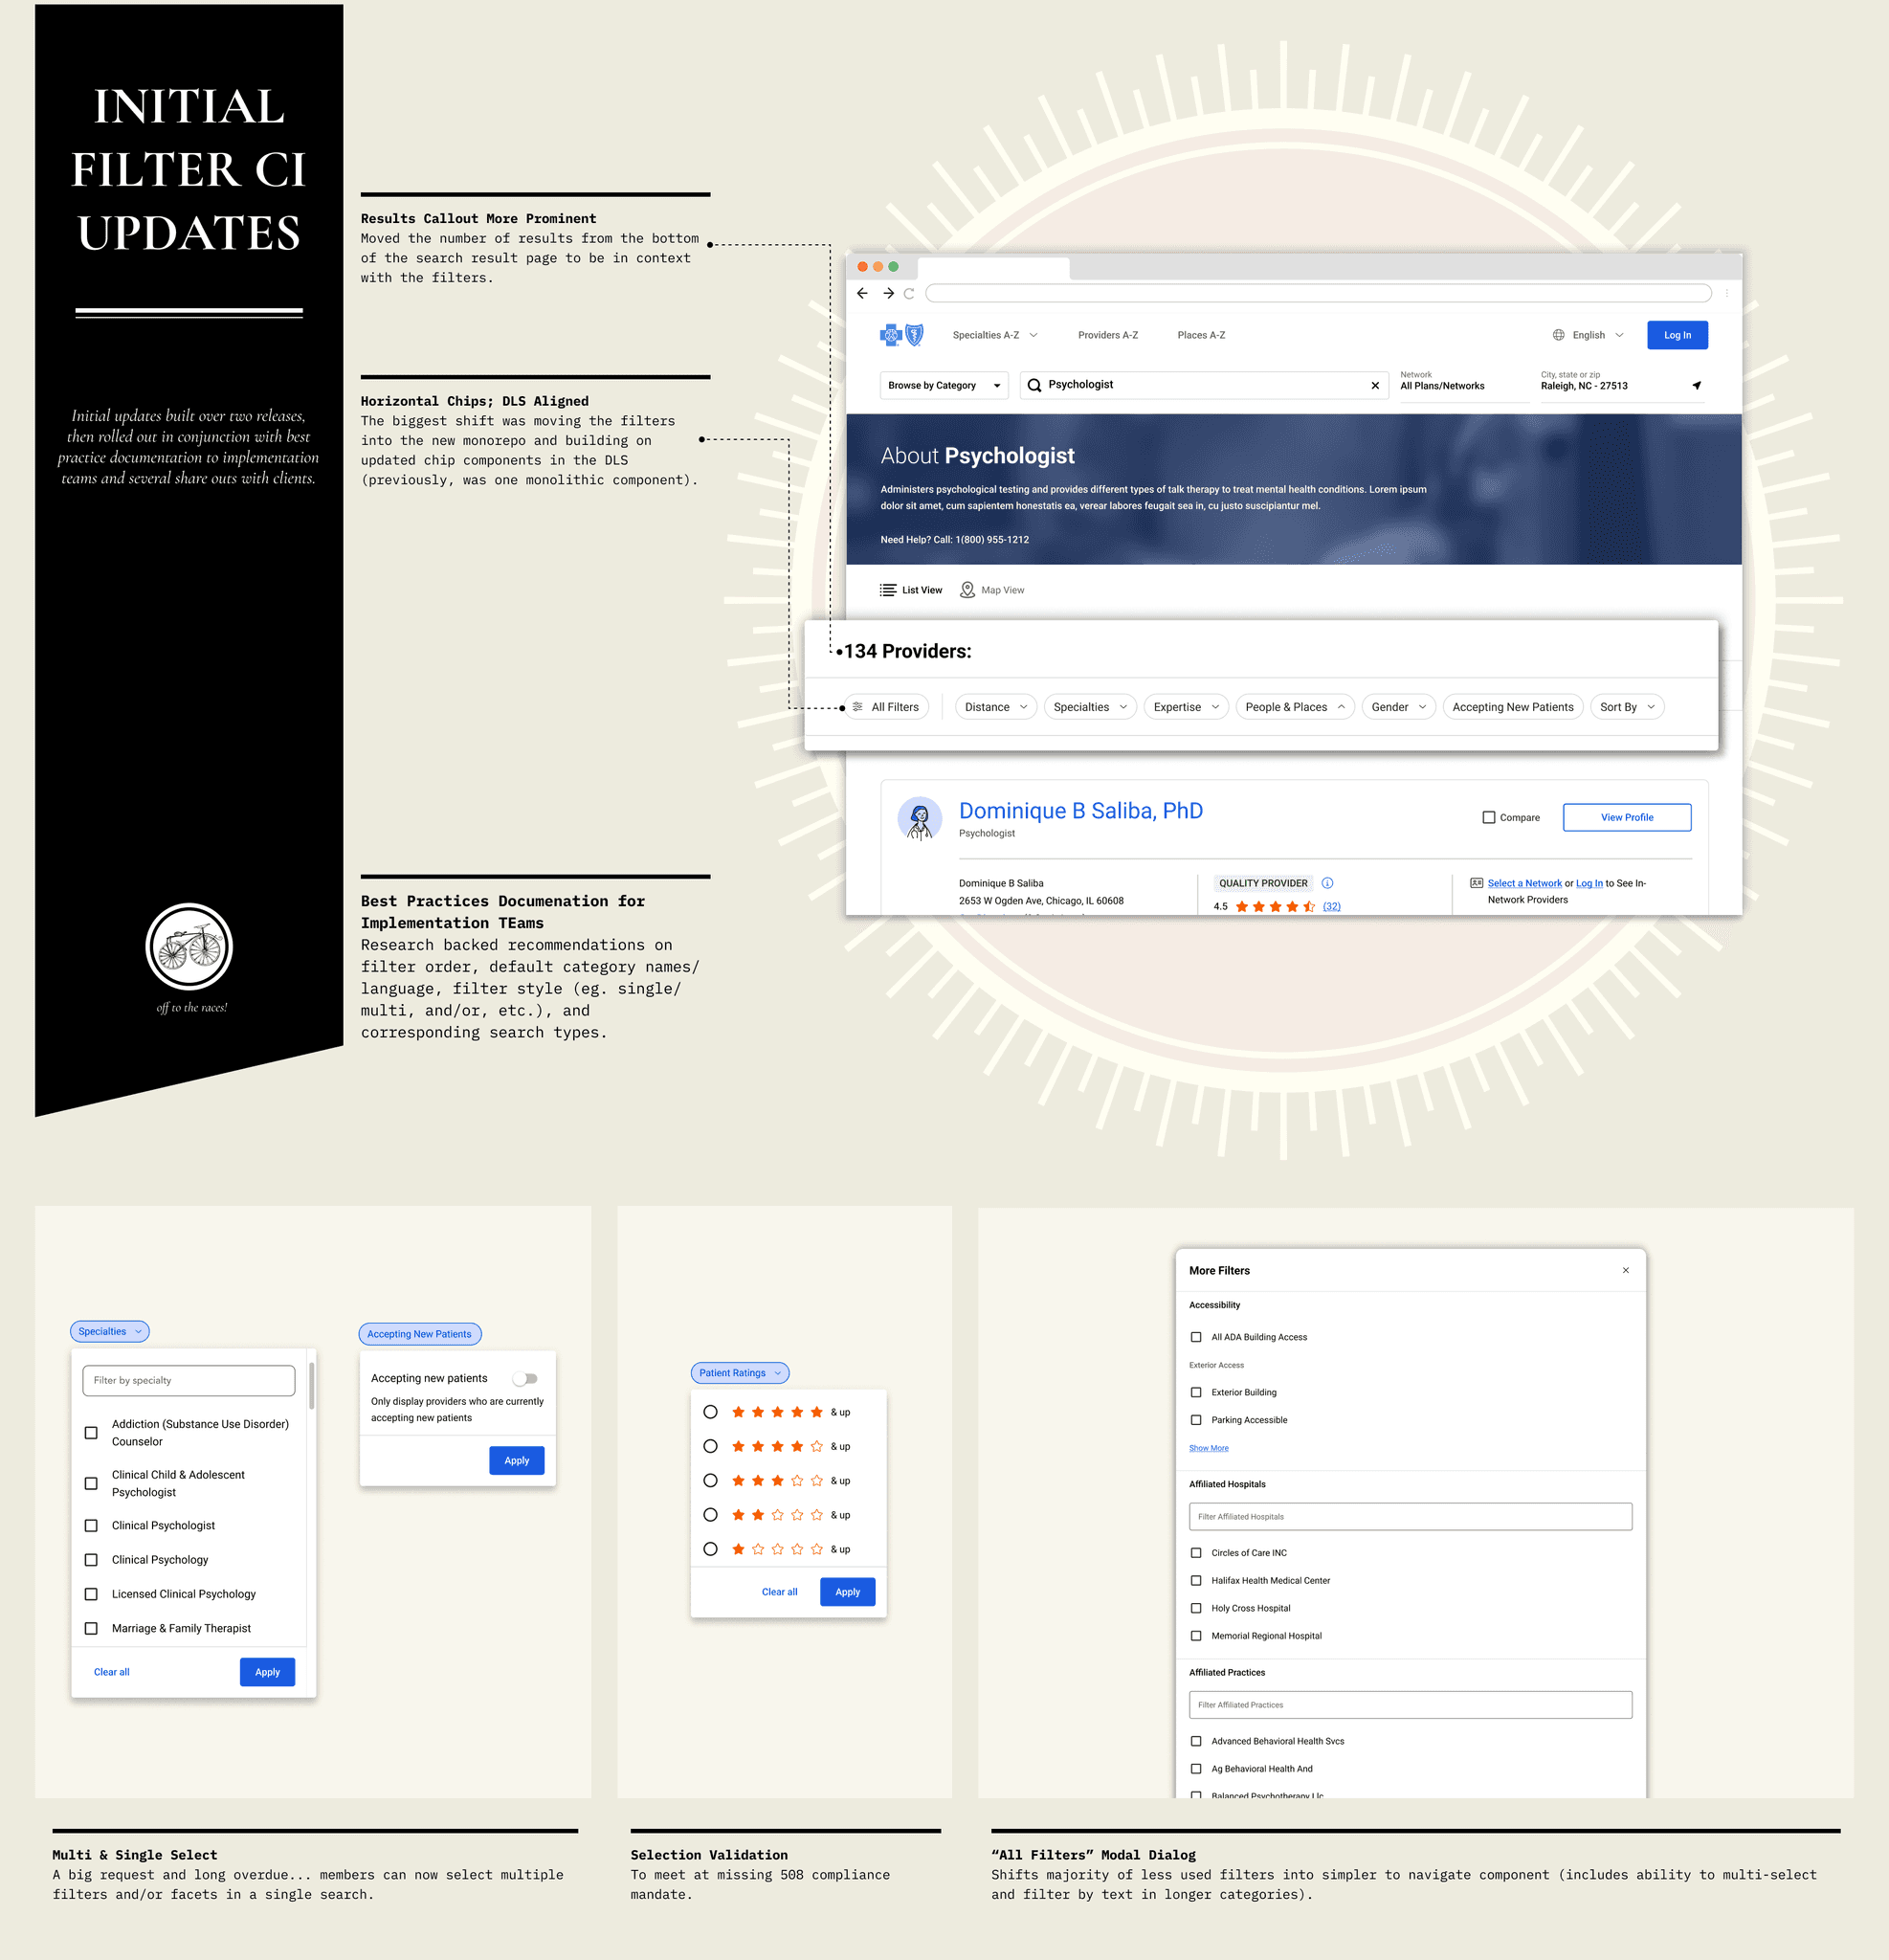
The overhaul of our filters was one of the first projects that enabled us to connect new process pieces together.
The team had always known that our filters were in need of a ground-up rethink; that the current experience frustrated members regardless of the task type they were trying to accomplish. Over the years, the Design team had engaged in a handful of Northstar explorations, thinking about what an overall evolution of the search experience could look like. This exploratory work helped unify the team on different schema and result types, that eventually ended up trickling into the newly evolved continuous improvement process.
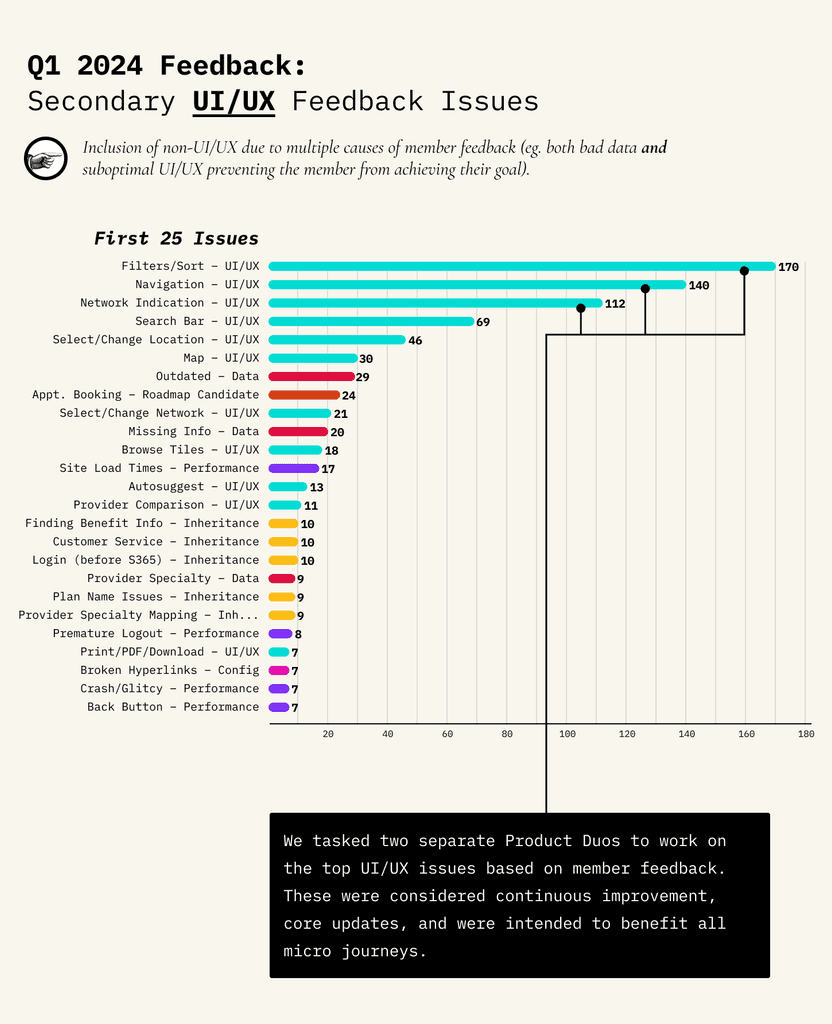
The CX Insights team, with the MX Index up and running, were able to collect member feedback from all micro journeys, catalog and sort it by issue-type. Figure X shows that complaints with filters were consistently one of the top member-reported complaints. The shift for us was that it was no longer a product manager or product designer’s “intuition” that filters needed revamping, but now the team could connect UI/UX prioritization specifically to member feedback volume across micro journeys and correlated satisfaction scores. (It’s also important to note that a lot of the feedback around filters wasn’t singularly about the UI/UX [which was, in fairness a big factor], but also because of incorrect provider data and confusing configuration-related decisions at the client-level: eg. “The filters were impossible to use on my phone and all the doctors that came back were listed as accepting new patients, but when I called, they said that wasn’t true!”).
Filter improvements were also tricky to get initial buy-in on, since there were so many legacy issues baked into them. They were constructed in a way that made them into a singular, monotonic component, driven to a large extent by client configuration decisions that spanned several years and several teams. These config and data decisions rested with the client.
Despite the complexity of fixing the experience, the CX Insights became a way to validate through numbers and metrics what we all felt: that our filters were in need of a massive overhaul. One of the Product Duos identified filters as especially relevant to their micro journey (“find a new specialist”), so we were able to carve out continuous improvement capacity to begin tackling the work. An added perk was that filter evolution would benefit all Duos and all micro journeys.
For context, here is what the filter experience looked like before the work began:
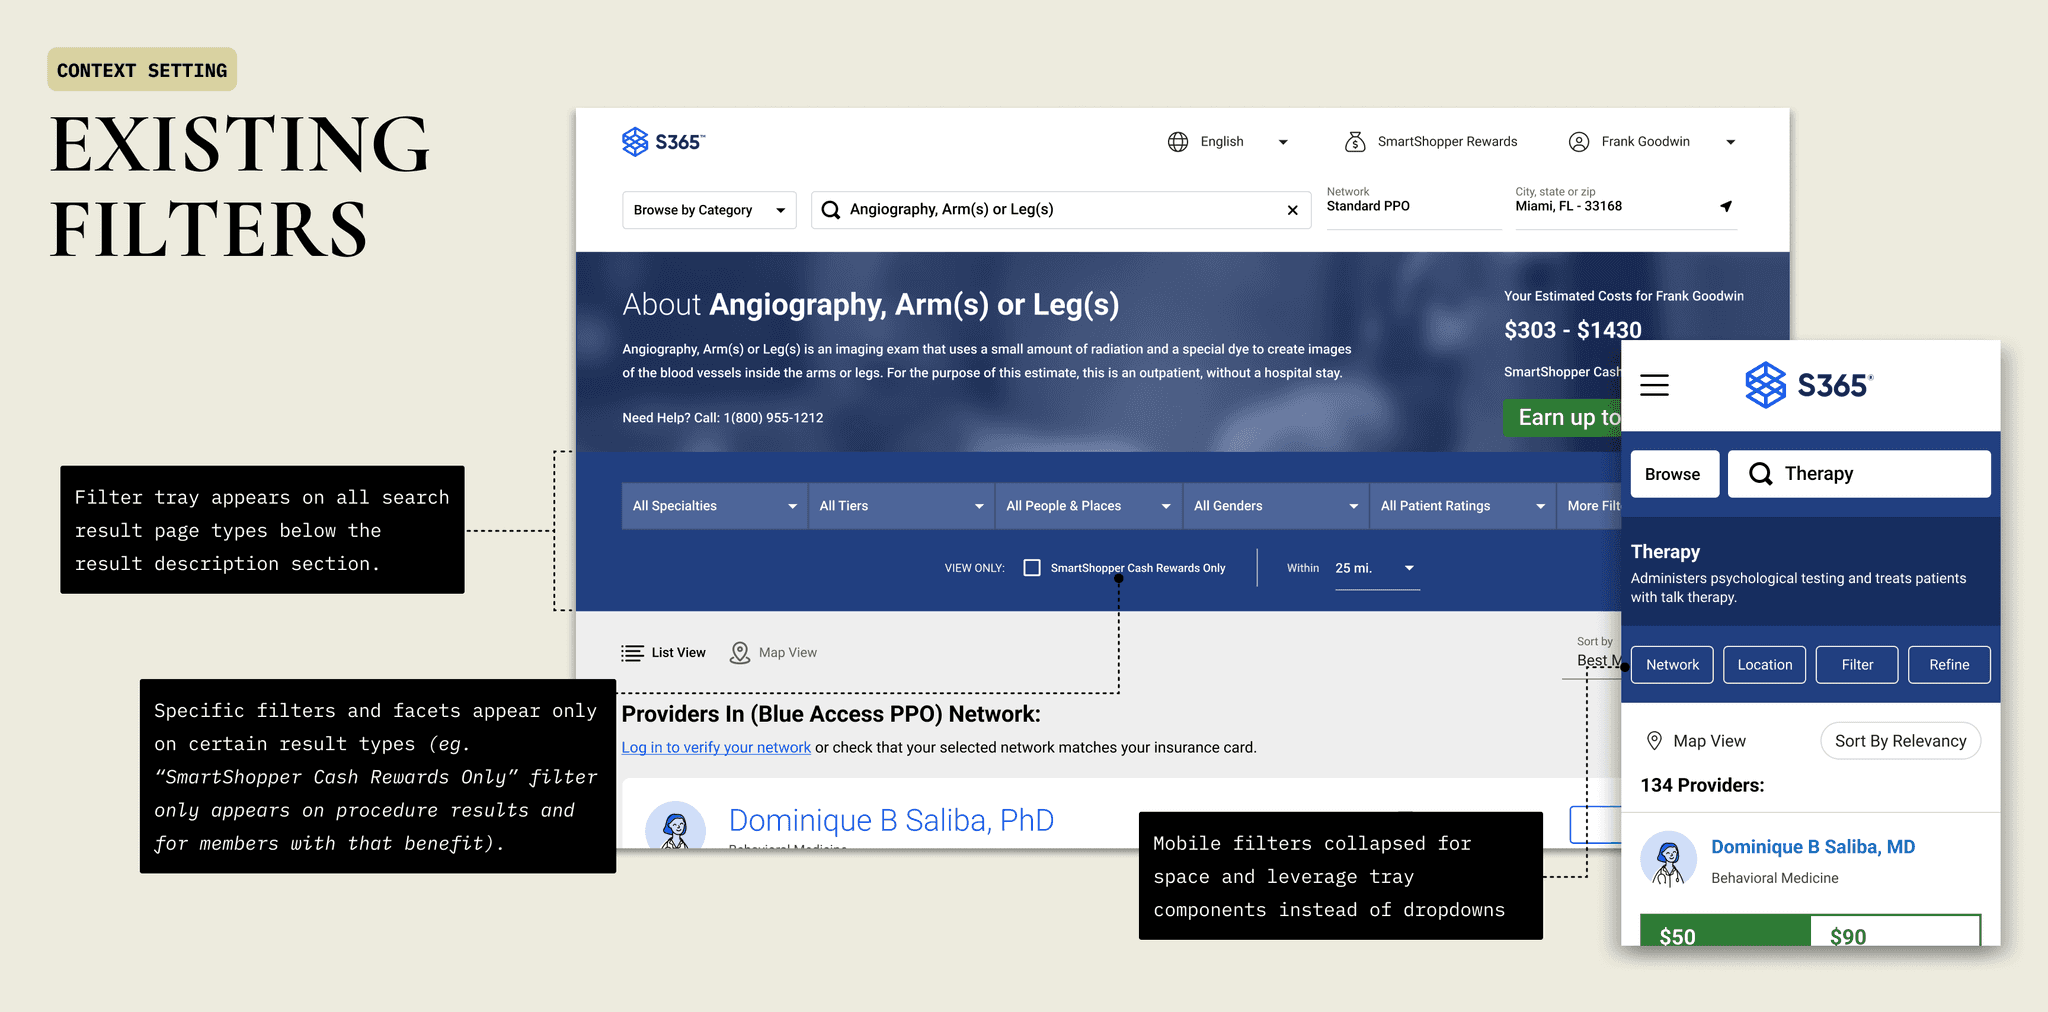
It’s important to stress how dependent the filter experience is on multiple improvement types flowing in coordinated, continuous conjunction. We could redesign the UI/UX of the filters every single release, but if members were filtering for in-network providers and the **data** was ultimately incorrect, they’d still have a horrible experience. Likewise, the configuration decisions on which order filters appeared and how datums were displayed, was a decision we could advise on, but was made at the client-level.
The Duo working on filters spent a good chunk of time during the Discovery phase unpacking and cataloging real world examples of issues along all experience facets, beyond those solely driven by bad UI/UX (most UI/UX issues were captured through heuristic analysis and member feedback analysis).
Examples of other issues impacting the filter experience included:
Confusing filter datum names: we displayed the exact datums clients sent over in their data files, which if they weren’t cleaned up, could be incredibly confusing to members and often too clinical.
Duplicative datums: since providers or their staff submitted their data themselves to health plans (often through different tools), there were instances of datums coming through to us that were the same thing, but listed multiple times with different titles (eg. One provider might list one of their languages spoken as “Serbian/Croati,” but a different provider might manually list they speak “*Serbo-Croatian*” and a lack of standardization on the client-side meant we display both options as two separate filter options).
Limited data and empty data sets: an industry level problem, gaps in data from providers was made all the more obvious by configuration (and often mandated) decisions to still show filter options as empty sets.
[05]
CODA:
UNIFIED MEASUREMENT
Connecting the product operating model to something.
At the end of our first year of having the MX Index live, we were moving towards a world where measurement drove business change. Constructing a unified measurement framework that tied together product and program metrics to deliver active insights was a foundational step in achieving that goal.
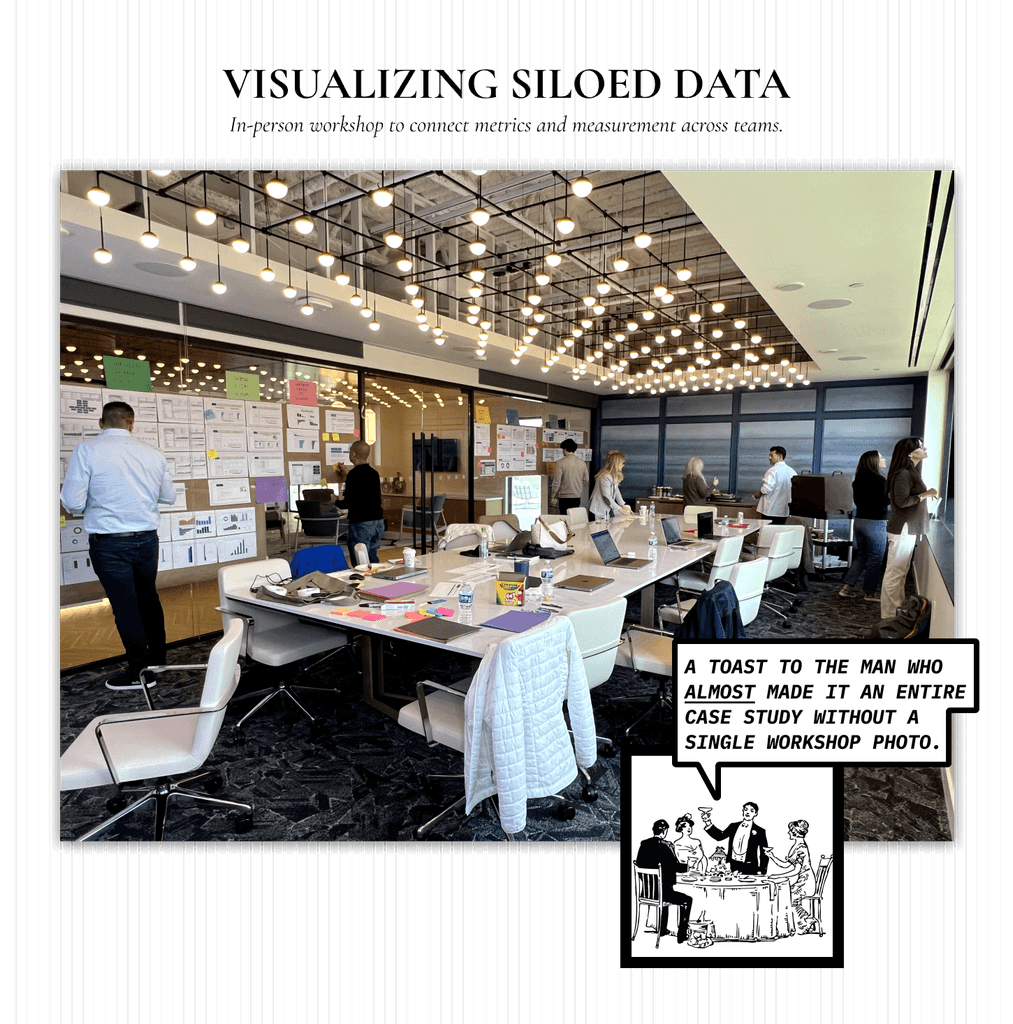
A cross-functional team of Business-Intelligence, Product, and Program Strategy met for an in-person workshop to produce the initial version of the unified measurement framework.
WORKSHOP GOALS:
Uncover and align on the challenges around why having a unified approach to measurement has been difficult up to this point
Align on KIPs and layout of a unified measurement framework
Agree on and layout next steps for a proximate objective that brings the measurement framework to life
Leading the workshop with identifying existing challenges helped create a shared frame for the different teams. We noted:
Data was siloed across teams, which made it difficult to connect program, Product, and MX metrics together (absence of a service-design approach)
We were sitting on a massive mine of healthcare consumer data, but weren’t making use of it in a meaningful way (a lack of north star metrics made knowing what to look for difficult)
Different business models and operating in a B2B2B2C context made identifying unified metrics more complex
Not a lot of internal priority for defining product metrics/performance
We had historically had a difficult time knowing what members were doing inside our products (eg. low authentication rates, lack of segmentation, etc.)
BUILDING V1 OF A UNIFIED MEASUREMENT FRAMEWORK
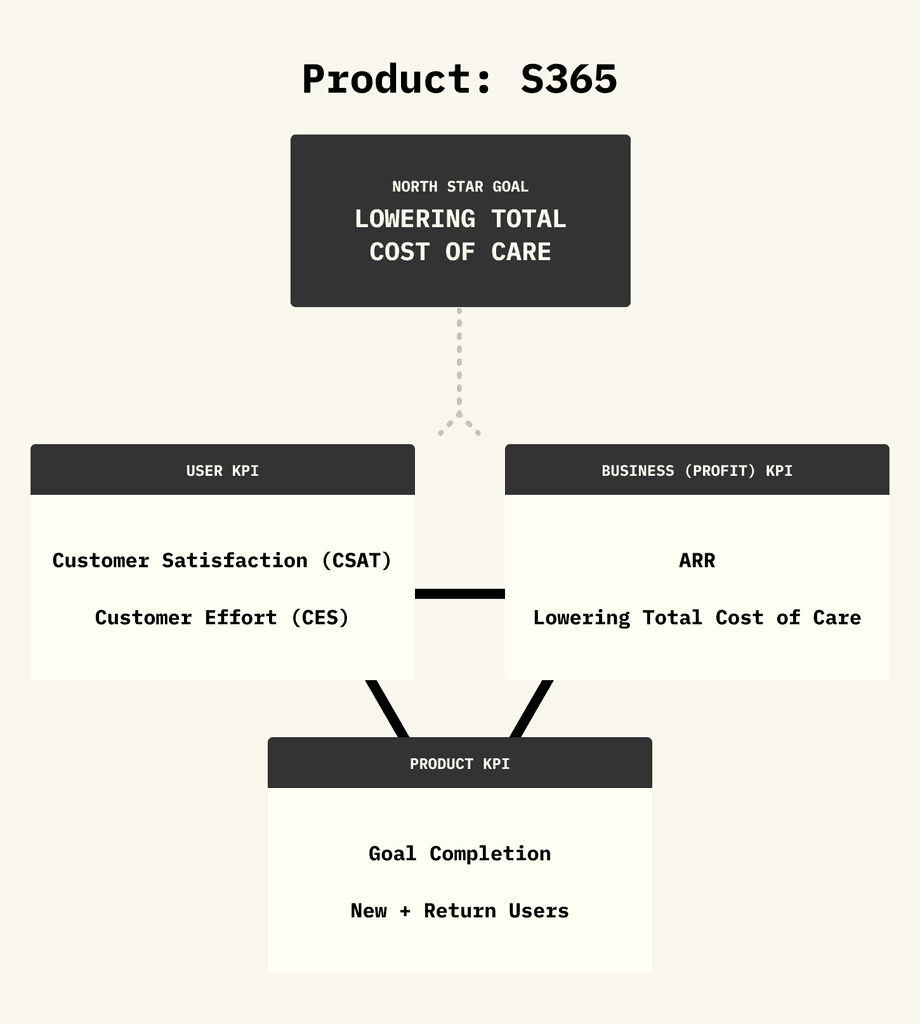
Creating a unified measurement fraemwork was inherently more copmlex given our business model(s). The framework we established contained individual product level KPIs, with shared program KPIs flowing through each product, but measured at the program level as well. Program success is dependent on product usage, performance, and user satisfaction. This forms a sort of “triad” of KPIs, that must co-exist and be equally prioritized in order to drive business growth. Metrics were to be measured the same way across products, but KPIs for products can and should be different depending on the goals for a given point in time.
Is this the be-all-end-all-100%-perfect way of conducting measurement? Of course not! This was our first stab at unifying different teams that had different metrics and objectives. This was and is intended to evolve over time – we just needed a starting point to begin iterating on.
The move the a product operating model would be dependent on a shared sense of metrics and overall agreement on underlying philosophy on what KPIs mattered the most. This was an attempt to stitch our Product approach into the fabric of the organization.


